CondoBlackBook.com's analysis of the overall Miami luxury condo market for Q1 2020 revealed a good start to the year, despite the coronavirus outbreak. Though the first quarter's sales were soft, the market has yet to reflect any major impact from the onset of the pandemic. A reduction in the year-over-year Days on Market and Months of Inventory further revealed that the overall Miami market kick-started the year on a positive note. Also, with prices trending lower year-over-year and inventory levels still high, the overall market in Miami seems to still be in favor of buyers.
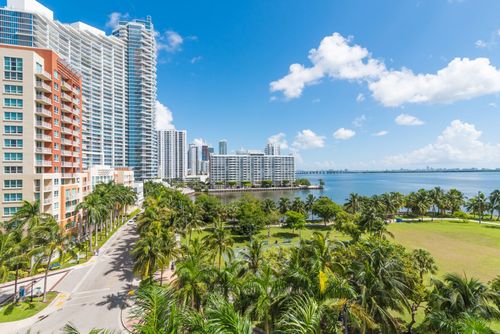
In this neighborhood-level report for Coral Gable and Coconut Grove, these desirable Miami neighborhoods led sales growth in 1Q20 for all of Miami, almost doubling year over year. However, sales prices decreased. Read on to see how the luxury condo market fared in Coral Gables and Coconut Grove, and how this data correlates to the overall market trends found in Miami.
For the purpose of this Miami submarket luxury condo report, we've only featured properties priced $1 million and above.
Coral Gables and Coconut Grove Luxury Condo Market Q1 Highlights:
- Q1 sales strong, almost double year-over-year
- Best-performing neighborhood in Miami in terms of year-over-year sales growth (76% growth) percentage
- 12-month sales trendline keeps positive from Q2 2019 to Q1 2020
- Q1 price per sq. ft. declines 10.3% year-over-year to $508 - lowest in Miami for luxury condos
- Days on market increase 24.4% year-over-year
- Inventory down 42.1% year-over-year
Table of Contents
- Coral Gables & Coconut Grove Luxury Condo Sales Trends
- Coral Gables & Coconut Grove Luxury Condo Price Trends
- Coral Gables & Coconut Grove Luxury Condo Days on Market Trends
- Coral Gables & Coconut Grove Luxury Condo Inventory Trends
- Conclusion
Coral Gables & Coconut Grove Lead Q1 Luxury Condo Sales in Miami
Coral Gables and Coconut Grove Luxury Condo Market Summary 1Q20 - Fig. 1

Q1 opens strong, sales almost double year-over-year with positive trendline. Moving against the overall market trend in Miami, this combined neighborhood starts the year strong with a 76% increase over Q1 last year (fig. 1). This is the highest the sales have been in a first-quarter since 2015, and the second-highest of all quarters in the period under review (fig. 2.1).
A closer look at fig. 2.2 below reveals that sales from January and March contributed to this boost. While February reported the same number of (7) sales year-over-year, January's sales more than doubled (13) from 6 in 2019 and March saw a spike of 10 compared to its 4 sales last year. These higher than normal sales in 1Q20 keep the 12-month trendline positive between Q4 2019 and Q1 2020 (fig. 2.3).
What's worth noting is that the combined district sees a recovery after the perpetually lower year-over-year sales of 2019 compared to 2018, despite the COVID-19 outbreak.
Coral Gables & Coconut Grove Quarterly Sales Heatmap 2015 - 2020 - Fig. 2.1

Coral Gables & Coconut Grove Monthly Sales from Jan. 2016 to Mar. 2020 - Fig. 2.2

Coral Gables & Coconut Grove 12-Month Sales with Trendline - Fig. 2.3

Q1 YoY Luxury Condo Prices Down
Q1 price per sq. ft. declines 10.3% year-over-year. Moving with the overall market trend in Miami, the sales price and price per sq. ft. declined for Q1 in this combined neighborhood (fig. 1). The price per sq. ft. fell 10.8% from $566 in 1Q19 to $508 in Q1 this year. Further, the median sales price slipped 15.2% year-over-year from $1,400,000 to $1,187,500.
A closer look at the five-year snapshot of quarterly prices in fig. 3 reveals that the quarter's price per sq. ft. trended toward the lower-end of the period under review. It is also worth noting that luxury condos in Gables and Grove have the lowest price per sq. ft. in all of Miami. The key takeaway on this is Coral Gables and Coconut Grove seem to be moving closer to a market correction in terms of pricing, and buyers are taking note.
Coral Gables & Coconut Grove Quarterly Price per Sq. Ft. 2016-2020 - Fig. 3

Days on Market Up YoY
24.4% increase in year-over-year days on market. Luxury condos in the Coral Gables and Coconut Grove grouping spent 22 more days on market compared to Q1 2019, as well as 2 more days on median over last quarter (fig. 4). Moving against the overall Miami market trend of a decline in days on market, this increase shows that even though the combined neighborhood saw improved sales, buyers and sellers took longer to reach a consensus on deals.
Coral Gables & Coconut Grove Quarterly Days on Market 2018-2020 Heatmap – Fig. 4

Inventory Down to Lowest in Miami
Inventory down to 22 months. With the first quarter delivering a big boost in sales, inventory definitely decreased in this combined neighborhood. Not only is inventory down from December's closing of 27 months, but also March 2019's tally of 38 months (fig. 5).
Consistent with the overall market trend in Miami, inventory sees a drop of 42% on a year-over-year basis - cut almost by half. This combined neighborhood also emerges as the district with the lowest months of inventory for the quarter of all the neighborhoods included in our overall study. However, considering 22 months is still way off the ideal 9-12-month benchmark of a balanced market, buyers should still have fair amounts of choices and lower prices working in their favor when searching. To look at what inventory is available, search for Coral Gables or Coconut Grove condos for sale here.
Coral Gables & Coconut Grove Months of Inventory from Mar. 2019 to Mar. 2020 - Fig. 5

A balanced market has only 9-12 months of inventory. The months of inventory are calculated as – no. of active listings + no. of pending listings divided by the average number of deals in the last 6 months.
Conclusion
Collectively, the market trends reported by Coral Gables and Coconut Grove deviate from the major trends seen in the Q1 2020 Overall Luxury Condo Market Report. Quarterly sales increase for the neighborhood, whereas the overall market reports a decline. The days on market trend higher for the submarket, while they post a reduction for Miami overall. Also, the 12-month trendline stays positive for Gables and Grove against a negative 12-month trendline seen in the overall report.
The only two metrics to move in line with the overall Miami luxury condo market report trends were prices and inventory, as they posted declines in this submarket as well. Overall, Gables and Grove report a healthier luxury condo market this first quarter.
Historically, Coconut Grove has been the fastest moving neighborhood in our quarterly studies from previous years, and as such, should be the first to reach the ideal 9-12-month benchmark of a balanced market. However, just as we've mentioned in our overall analysis, the presidential elections and COVID-19 outbreak will most likely prove to be hiccups along the road to a balanced market, extending the ongoing buyer-friendly climate. The flipside of this is that Coconut Grove and Coral Gables offer a lot of green space, parks, and less urban density, which may be highly desirable to buyers after the experience of COVID-19 quarantine rules. Nonetheless, this will be the market to watch for signs of recovery whenever the dust starts to settle.
Love what you see? Don't forget to share our blog and subscribe (see the subscribe link on the top menu) to receive the latest Miami condo market news in your inbox.
Questions or comments about the stats? Want more info on Miami condos? Contact Sep at sniakan (at) hbroswell.com or call 305-725-0566.