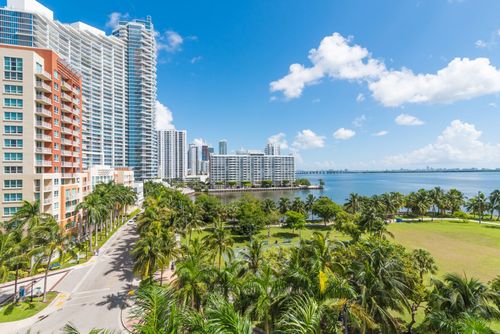
As our CondoBlackBook.com 2Q20 report for this combined neighborhood showed exceptional sales growth, the outlook for 2Q20 was more than positive. However, with the COVID-19 situation unfolding globally, the full impact on numbers can be seen this quarter. Much like the overall Miami luxury condo market for 2Q20, sales are naturally down year-over-year. Still, the tail-end of the quarter has revealed signs of a recovery, which is likely to continue into the third quarter, at least.
Median Sales Prices also show an upward trend, in sync with the overall market trend in Miami, showing that sellers received good value for their properties even as the pandemic weighed down on sales. Read on below for a more detailed analysis of the impact on monthly sales, the Price per Sq. Ft., Days on Market and Months of Inventory in this second-quarter plus how trends correlate to the overall luxury condo market in Miami.
For the purpose of this Miami submarket luxury condo report, we've only featured properties priced $1 million and above.
Coral Gables and Coconut Grove Luxury Condo Market Q2 Highlights:
- Q2 Sales dip 40.7% year-over-year due to pandemic-related global slowdown
- 12-month trendline shifts from positive in 1Q20 to negative this quarter
- Prices report an upward trend, showing good value for sellers
- Price per Sq. ft. jumps 26.9% quarter-to-quarter to $636/sq. ft.
- Days on Market increase 12.4% year-over-year
- Inventory down year-over-year to lowest in Miami, despite COVID-19 pull on sales
Table of Contents
- Coral Gables & Coconut Grove Luxury Condo Sales Trends
- Coral Gables & Coconut Grove Luxury Condo Price Trends
- Coral Gables & Coconut Grove Luxury Condo Days on Market Trends
- Coral Gables & Coconut Grove Luxury Condo Inventory Trends
- Conclusion
Luxury Condo Sales Down in Q2
Coral Gables and Coconut Grove Luxury Condo Market Summary 2Q20 - Fig. 1
|
Number of Sales |
Median Sale Price |
Quarters |
Median Sp/Sqft |
% Change in Sales |
% Change in Median Sale Price |
% Change in Median Sp/Sqft |
Median of DOM |
|
16 |
$1660000.00 |
2020 Q2 |
$636.00 |
-40.7% |
23.0% |
-0.5% |
100 |
|
27 |
$1350000.00 |
2019 Q2 |
$639.00 |
|
|
|
89 |
Disclaimer: Data sourced from MLS 9 April 2020. Precaution has been taken to ensure that the content and analysis is accurate and current, however figures may be subject to revision.
Sales decline (as expected) 40.7% year-over-year with negative trendline. Even with a notable first-quarter performance (76% year-over-year increase), we see sales declining in Q2 for this combined neighborhood, absorbing the full impact of the COVID-19 situation. Traditionally the strongest of the year, this second quarter conversely comes up short on sales as a natural response to the lockdown during the months of March and April.
As expected, the combined neighborhood of Coral Gables and Coconut Grove registers a dip of 40.7% against the same quarter last year (fig. 1). This is in sync with the overall sales trend observed in the overall luxury condo market report for 2Q20.
A closer look into the Monthly Sales chart (fig. 2.2) reveals that even as sales dipped through most of the quarter, they did pick up by the tail-end. So, as April reported half the sales (4) compared to 2019 (8) and May came up with one-third (3) the sales for the same month 2019 (9), June showed stability by reporting 9 sales against its previous year total of 10. This shows that, as the city reopened to its "new normal," pent up buyer demand started coming through. In fact, we can positively report that Miami's luxury condo market is still very active going into the third quarter.
Capturing the general slowdown in momentum this second quarter, the 12-month trendline in fig. 2.3 turns negative from a positive in the previous quarter.

Disclaimer: Data sourced from MLS 9 April 2020. Precaution has been taken to ensure that the content and analysis is accurate and current, however figures may be subject to revision.

Disclaimer: Data sourced from MLS 9 April 2020. Precaution has been taken to ensure that the content and analysis is accurate and current, however figures may be subject to revision.

Disclaimer: Data sourced from MLS 9 April 2020. Precaution has been taken to ensure that the content and analysis is accurate and current, however figures may be subject to revision.
Q2 Luxury Condo Prices Up YoY
Price/sq. ft. flat as Median Sales Price increases 23% year-over-year. Moving with the overall market trend in Miami, prices trend higher in this combined neighborhood. The Median Sales Price increased from $1,350,000 in the same quarter a year ago to $1,660,000 this year, posting an increase of 23% (fig. 1).
Also, while the Price per Sq. Ft. remained flat year-over-year ($639 in 2Q19 to $636 in 2Q20), a closer look at fig. 3 reveals a marked improvement of 26.9% quarter-over-quarter ($501 in 1Q20 to $636 in 2QQ20). This upward trend in prices for the neighborhood shows that even though sales were much slower than average, sellers still got fair value for their luxury condos.
It is also worth noting that the Price per Sq. Ft. has now moved closer to the higher-end of the price range traced over the past five years (as seen in the quarterly snapshot below), so much so that it is no longer the 'lowest priced' neighborhood for luxury condos in our study.

Disclaimer: Data sourced from MLS 9 April 2020. Precaution has been taken to ensure that the content and analysis is accurate and current, however figures may be subject to revision.
Days on Market Up YoY, But Lower QoQ
12.4% increase in year-over-year Days on Market. Moving against the overall market trend of a decline in Days on Market, this combined neighborhood posts an increase in year-over-year medians. Luxury condos spent 11 more days on market compared to the same quarter last year (fig. 4). Conversely, they spent 12 fewer days on market compared to the first quarter this year.
With a steady decline in numbers noticed over the past three quarters, the outlook is still positive as buyers and sellers continue seeing eye-to-eye on the value of transactions in the Coral Gables and Coconut Grove luxury condo market.

Disclaimer: Data sourced from MLS 9 April 2020. Precaution has been taken to ensure that the content and analysis is accurate and current, however figures may be subject to revision.
Inventory Still the Lowest in Miami
Q2 closes with 25 months of Inventory. Even as the shelter-in-place orders curbed sales momentum this quarter, the collective grouping of Coral Gables and Coconut Grove reported the lowest levels of inventory compared to all other neighborhoods included in our study. Moving against an upward overall market trend, at 25 months, inventory is 13.8% lower than June-end last year (29 months).
However, compared to March's closing of 22 months (all-time low for the combined neighborhood), inventory posts a 13.6% quarter-to-quarter increase. Of all Miami neighborhoods included in our reporting, Coral Gables and Coconut Grove are still poised to be one of the first to reach the ideal 9-12-month benchmark of a balanced market out of all Miami neighborhoods. So buyers should consider this and make the most of this window of opportunity before median prices trend higher. For a look at the sort inventory available, search for Coral Gables or Coconut Grove condos for sale here.

Disclaimer: Data sourced from MLS 9 April 2020. Precaution has been taken to ensure that the content and analysis is accurate and current, however figures may be subject to revision.
A balanced market has only 9-12 months of inventory. The months of inventory are calculated as – no. of active listings + no. of pending listings divided by the average number of deals in the last 6 months.
Conclusion
When compared to Miami's overall luxury condo market trends, the collective neighborhood of Coral Gables and Coconut Grove conforms only in part this second quarter. Consistent with the drop seen in the overall Sales numbers, this combined neighborhood reports a much-anticipated decline. The 12-month trendline too is negative in response, just like the Miami overall report. Also, contrary to what most people believed, prices have seen an uptick in this submarket, much like the overall market. This is a definite thumbs-up for sellers in the area, giving them good value for their properties despite the disruption caused by the pandemic.
The two metrics moving in contrast to the overall market are Months of Inventory and Days on Market. Coral Gables and Coconut Grove report a year-over-year decline in inventory, retaining their title of the "neighborhood with the lowest inventory in Miami." On the other hand, the Days on Market for the neighborhood went up, moving against a decline seen in the overall report.
Historically, Coconut Grove has been the fastest moving neighborhood in our quarterly studies from previous years. It is also a less densely populated urban area with lots of green space, waterfront living and several marinas, making it quite appealing to buyers from cities such as NYC, Boston or Chicago. Combining that with the lowest levels of inventory in Miami, it is still poised to be one of the first neighborhoods to reach the 9-12-month benchmark of a balanced market.
However, with the two major wildcards influencing the markets this year – the COVID-19 crisis and Presidential elections – there is no precise predicting of when the luxury condo market in Miami will break out of the buyer-friendly climate. Until then, buyers can enjoy all of the benefits (price- and choice-wise) that come with a market much in their favor.
Love what you see? Don't forget to share our blog and subscribe (see the subscribe link on the top menu) to receive the latest Miami condo market news in your inbox.
Questions or comments about the stats? Want more info on Miami condos? Contact Sep at sniakan (at) hbroswell.com or call 305-725-0566.


