Positive signs for Miami's Coastal Neighborhoods: As mentioned in the overall Miami Luxury Condo Market Report for Q4 2022, most Miami Beach and coastal neighborhoods reported their second-biggest year in terms of sales, despite a seasonal slowdown pausing momentum over the second half of 2022. In a nod to general market health, prices peaked to an all-time high in most sub-markets, Days on Market remained low, and with high season on the horizon, we as real estate experts, expect market growth to resume and any surplus inventory to be wiped off quickly.
In 2022, Sunny Isles Beach emerged as the most resilient market of the Miami Beach-area neighborhoods, reporting the least negative impact on annual sales growth. As usual, Fisher Island stayed in the lead in terms of pricing – reporting the most expensive Price per Square Foot in Miami along with maximum gains in 2022-over-2021 prices. The exclusive island neighborhood also turned out to be the fastest-selling market of Q4 2022, as luxury condos took only 27 days to sell.
Read on for more year-over-year insights in our exclusive and detailed analysis on how each Miami Beach-area neighborhood fared against each other, as well as against the overall Miami luxury condo trends and real estate market statistics in Q4 2022, as well as on an annual basis in 2022.
For the purposes of this report, we've included in "Miami Beach" the sub-neighborhoods of South Beach, Mid-Beach, North-Beach, Sunny Isles Beach, Surfside, Bal Harbour, and Fisher Island as part of our Miami Beach-area grouping. Also, this luxury condo submarket report only features properties priced at $1 million and above.
2022 Annual Miami Beach + Sub-neighborhood Luxury Condo Market Stats Summary:
- Annual Sales down -21.5% compared to record-setting 2021, but second-best year ever
- Annual Price per Square Foot up to $1,103 in 2022-over-2021 analysis
- Annual Days on Market down 17% in 2022-over-2021 analysis
- Winners: Sunny Isles Beach topped popularity charts, emerged as the most resilient market in greater Miami Beach area with least impact (-13%) on 2022-over-2021 sales growth
- Winner: Fisher Island plus Surfside and Bal Harbour led price growth in Miami overall with highest percentage increase in Price per Square Foot – offering maximum value to sellers
- Winner: Fisher Island stayed the most expensive neighborhood of 2022 with a median price of $1,903/sq. ft.
- 2022 closed as a buyer's market, in theory, but sellers held equal advantage
Q4 2022 - Miami Beach Luxury Condo Market Highlights:
- Sales down -58.4% year-over-year
- 12-month sales trendline stayed negative between Q3 and Q4 2022
- At $1,130, Price per Square Foot up by 9.2% year-over-year to highest-ever
- Days on Market down 4.8% year-over-year
- Inventory up 100% year-over-year to 18 months
Q4 2022 - Miami Beach Sub-neighborhood Highlights:
- Winner: Mid-North Beach topped popularity charts in Miami Beach, with the lowest percentage decline (-55%) in year-over-year sales volume
- 12-month Sales Trendline negative across the board
- Winner: Fisher Island posted highest percentage growth in year-over-year price per sq. ft. (75%) in Miami Beach and Miami overall, replacing Surfside & Bal Harbour from top spot in Q3 2022
- Winner: Fisher Island continued as the most expensive neighborhood in Q4 2022 with a median price of $2,584/sq. ft.
- Fisher Island emerged as the fastest-selling market in Miami Beach and overall Miami, as luxury condos took only 27 days to market – from listing to closing
- Mid-North Beach reported the lowest year-end inventory (16 months) in Miami Beach
- Fisher Island posted the highest year-end inventory (21 months) in Miami Beach
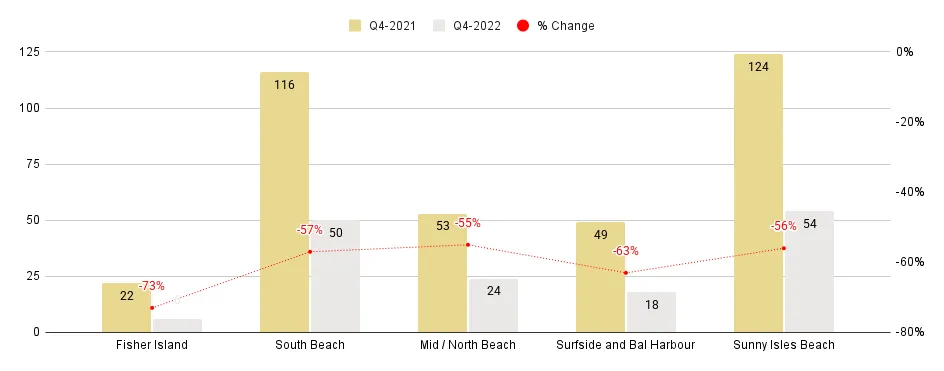
Miami Beach Luxury Condo Markets at a Glance - Q4 2022 YoY (Number of Sales)
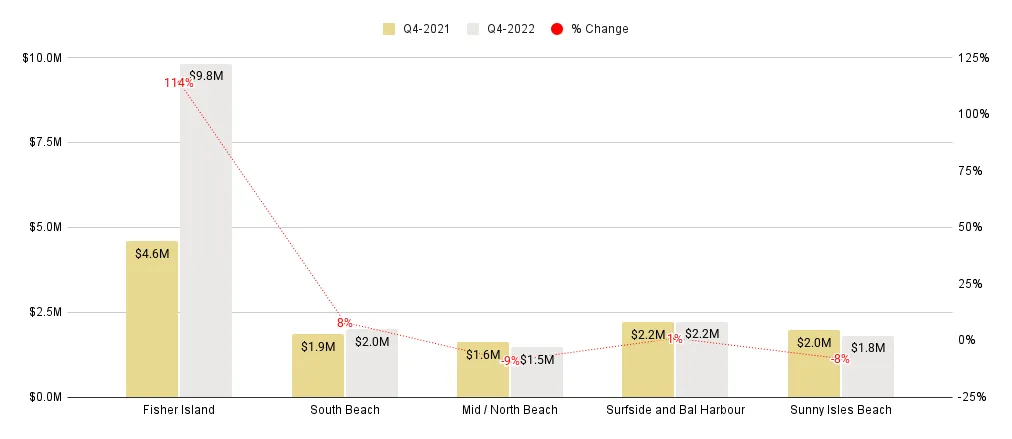
Miami Beach Overall Luxury Condo Markets at a Glance - Q4 2022 YoY (Median Sale Price)
Miami Beach Luxury Condo Markets at a Glance - Q4 2022 YoY (Median Sales Price / SqFt)
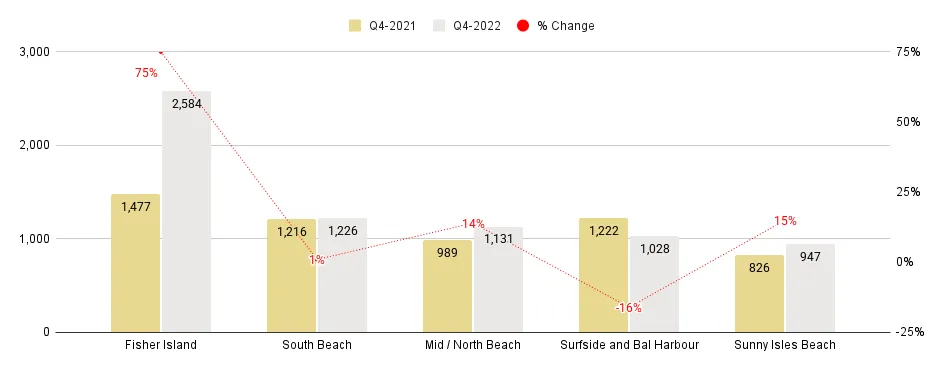
Table of Contents
- Overall Q4 2022 & Annual Miami Beach Luxury Condo Market Stats
- Q4 2022 & Annual South Beach Luxury Condo Market Stats
- Q4 2022 & Annual Mid and North Beach Luxury Condo Market Stats
- Q4 2022 & Annual Surfside & Bal Harbour Luxury Condo Market Stats
- Q4 2022 & Annual Sunny Isles Beach Luxury Condo Market Stats
- Q4 2022 & Annual Fisher Island Luxury Condo Market Stats
- Conclusion - Q4 2022 & Annual Miami Beach Luxury Condo Market Report
|
Q4 2022 vs Q3 2022 Miami Beach Miami Luxury Condo Market Summary - Fig. 1 |
|||||||
|
Quarters |
Number of Sales |
% change in Sales |
Median Sale Price |
% change in Median Sale Price |
Median Sp/Sqft |
% change in Median Sp/Sqft |
Median of DOM |
|
Q4-2022 |
152 |
-18.7% |
$2,000,000 |
11.1% |
$1,130 |
4.2% |
79 |
|
Q3-2022 |
187 |
$1,800,000 |
$1,085 |
68 |
|||
|
Q4 2022 vs Q4 2021 Miami Beach Miami Luxury Condo Market Summary - Fig. 1.1 |
|||||||
|
Quarters |
Number of Sales |
% change in Sales |
Median Sale Price |
% change in Median Sale Price |
Median Sp/Sqft |
% change in Median Sp/Sqft |
Median of DOM |
|
Q4-2022 |
152 |
-58.4% |
$2,000,000 |
-1.2% |
$1,130 |
9.2% |
79 |
|
Q4-2021 |
365 |
$2,025,000 |
$1,035 |
83 |
|||
|
Annual 2022-over-2021 Miami Beach Miami Luxury Condo Market Summary - Fig. 1a |
|||||||
|
Year |
Number of Sales |
% change in Sales |
Median Sale Price |
% change in Median Sale Price |
Median Sp/Sqft |
% change in Median Sp/Sqft |
Median of DOM |
|
2022 |
1253 |
-21.5% |
$2,000,000 |
0.0% |
$1,103 |
10.5% |
78 |
|
2021 |
1596 |
$2,000,000 |
$998 |
94 |
|||
— Annual & Q4-22 Miami Beach Luxury Condo Stats - Sales Down, But Market Stable
Q4 Sales Down -58.4% Year-over-year — Higher Than Any Pre-pandemic 4Q (2019 & before)
Echoing and strongly influencing the sales trend seen in the overall Miami report for Q4 2022, Miami Beach posted a decline in quarter-over-over and year-over-year sales, however it was still the second strongest sales year ever behind 2021:
- Q4 2022 vs Q3 2022. Sales dipped -18.7% quarter-over-quarter, down from 187 in Q3 to 152 in Q4 2022. (Fig. 1)
- Q4 2022 vs Q4 2021. Sales declined -58.4% year-over-year, down from 365 in Q4 of last year to 152 for the same quarter 2022. (Fig. 1.1)
- Still, Q4 2022 volumes were higher than any previous fourth quarter noted pre-pandemic (years 2019 and before). This shows that the market held on to its growth thresholds acquired over the past two years.
- Sunny Isles Beach was the highest contributor in terms of sales volume (54 sales).
- Mid-North Beach was the most resilient sub-market, reporting the least negative impact in year-over-year sales growth (-55%).
As the luxury condo market expectedly slowed down after about two years in overdrive plus with a seasonal pause setting in, sales in these beach neighborhoods closed the year soft. However, as real estate experts, we expect the market to pick up pace as high season approaches in Spring 2023, bringing the market to an equilibrium.
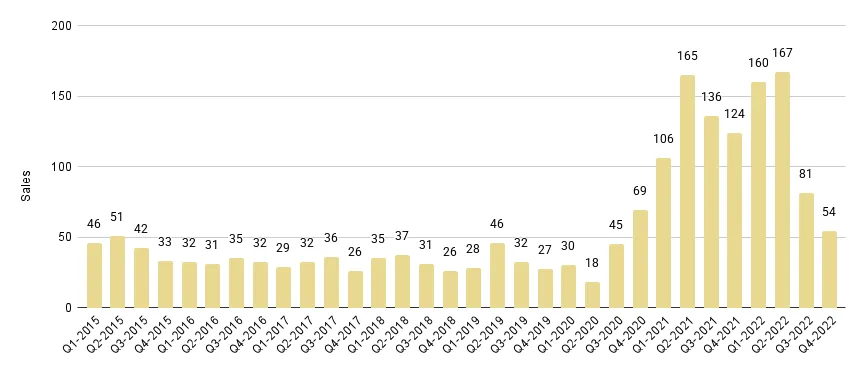
Annual Sales down -21.5% — Second-highest Sales in a Year — Negative Trendline
Owing to a record opening to the year (Fig. 2.1), the luxury condo market in this grouping of popular coastal neighborhoods reported its second-biggest year of sales, even as the market cooled drastically over the last two quarters:
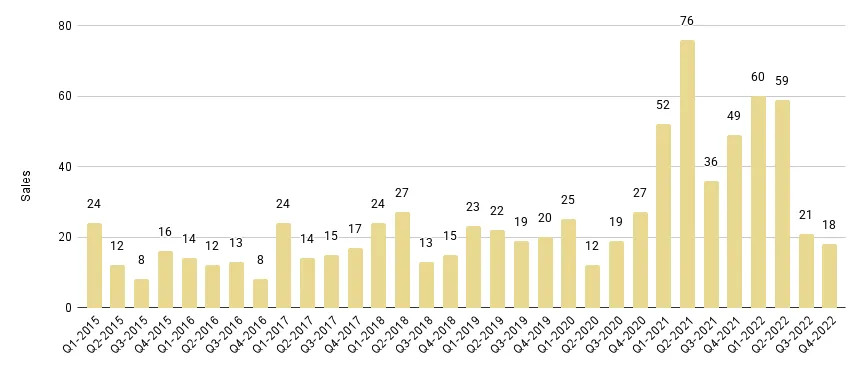
- 2022 vs 2021. Sales dipped 21.5%, down from 1,596 annual sales in the record-setting previous year to 1,253 in 2022. (Fig. 1a)
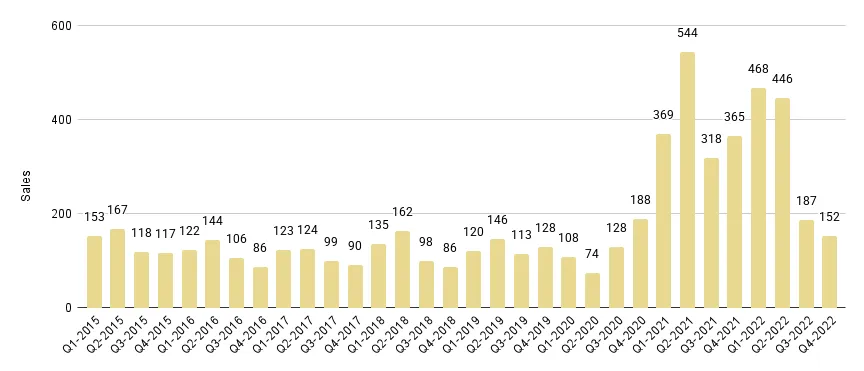
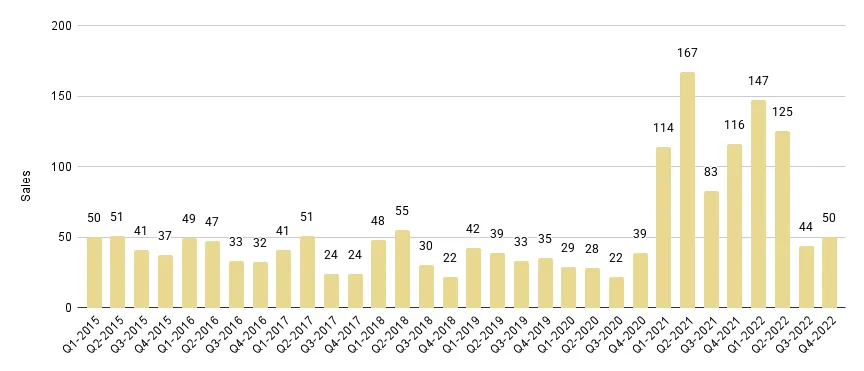
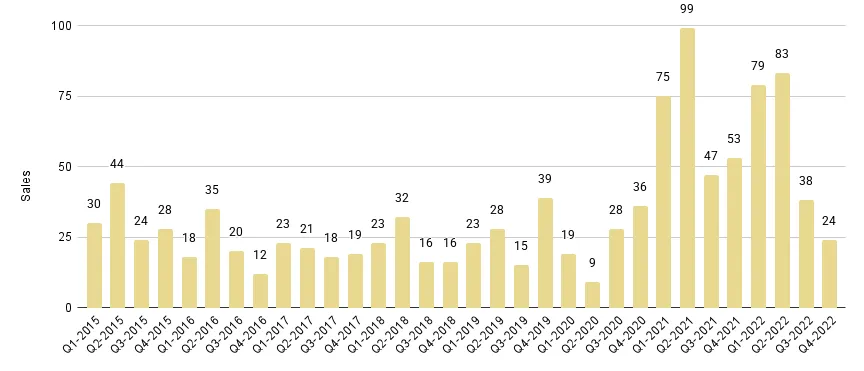
- However, with annual sales surpassing those from 2020 (498 total sales), 2019 (507 total sales), 2018 (481 total sales), and the years before – Miami Beach reported its second-biggest sales year on record. (Fig 2.1)
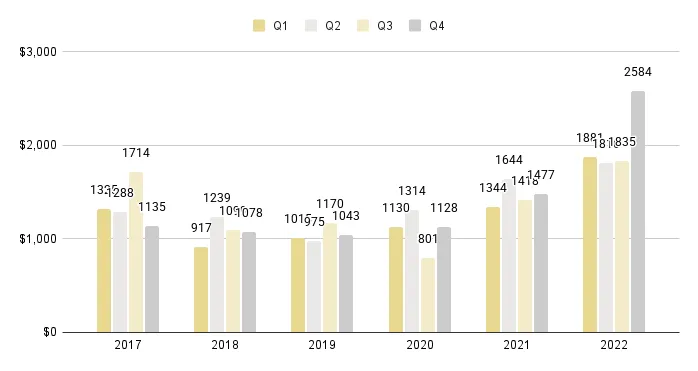
Miami Beach Luxury Condo Quarterly Sales 2015-2022 - Fig. 2.1
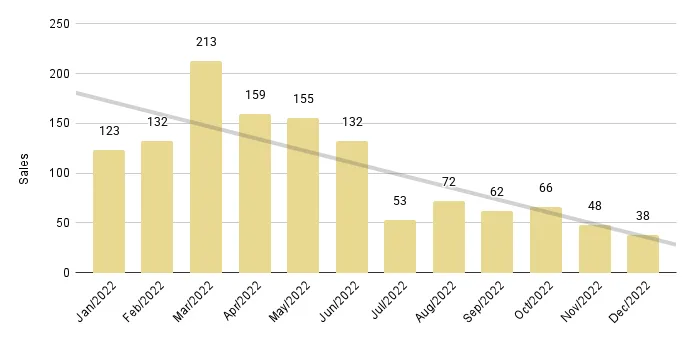
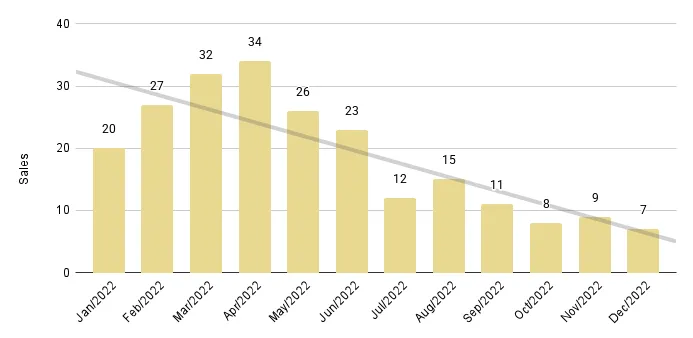
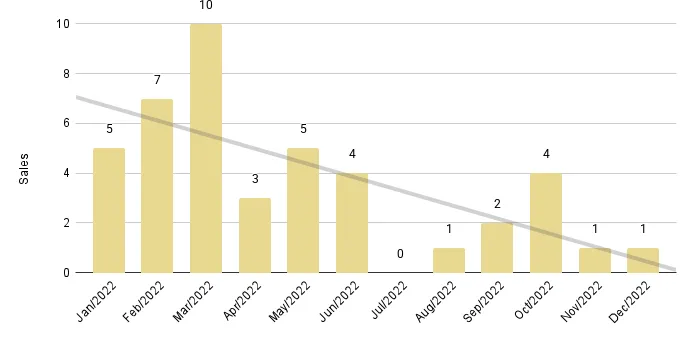
Miami Beach Luxury Condo Monthly Sales from Jan. 2016 to Dec. 2022 - Fig. 2.2
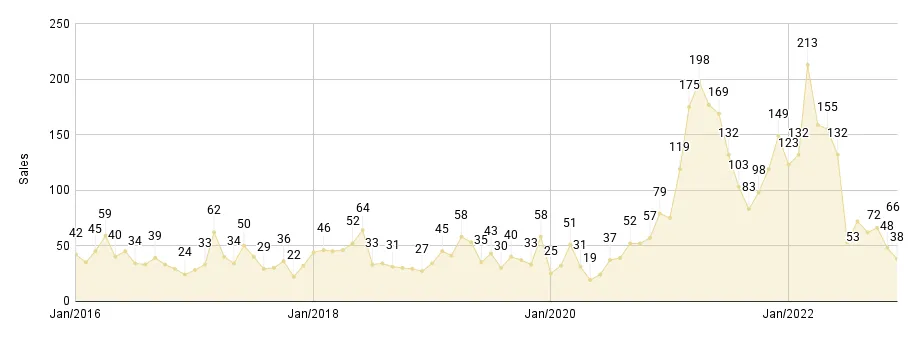
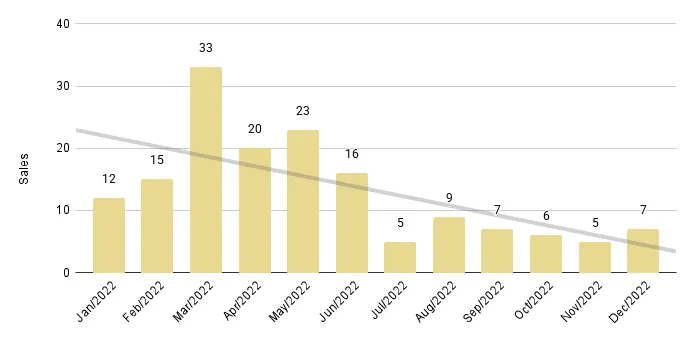
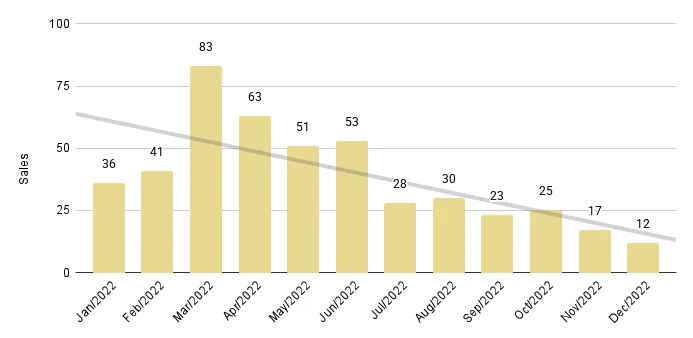
With the market cooling in anticipation of high season in 2023 (Spring is generally Miami's peak season for luxury condo sales, as noted historically), the 12-month Sales Trendline of Fig. 2.3 expectedly stayed negative between Q3 and Q4 2022.
Miami Beach Luxury Condo 12-Month Sales with Trendline - Fig. 2.3
— Miami Beach: Luxury Condo Prices Up Annually & Q4-22
Annual Price per Square Foot up to $1,103, Median Sales Price Flat
Consistent with the overall market trend of higher 2022-over-2021 Price per Square Foot and a flat Median Price, luxury condos in Miami Beach reported the following annual trends (Fig. 1.a):
- Price per Square Foot increased 10.5%, up from $998 in 2021 to $1,103 in 2022.
- Median Sales Price stayed flat, reporting no change from $2,000,000 in 2021.
Q4 2022 Price per Square Foot up 9.2% to Peak of $1,130 — Median Sales Price Flat Year-over-year
Deviating slightly from the overall Miami market trend of higher year-over-year Price per Square Foot and a lower Median Price, luxury condos in Miami Beach reported the following pricing statistics (Fig. 1.1):
- Q4 2022 vs Q4 2021. Price per Square Foot increased by 9.2%, up from $1,035 in Q4 2021 to an all-time high of $1,130 in Q4 2022.
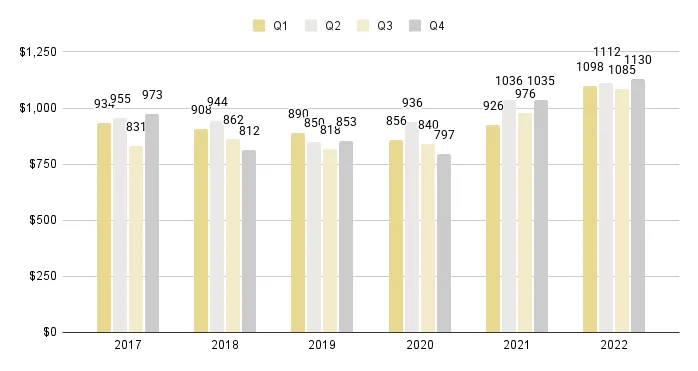
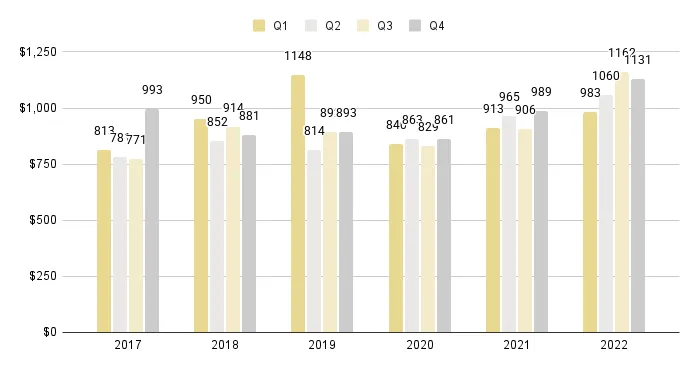
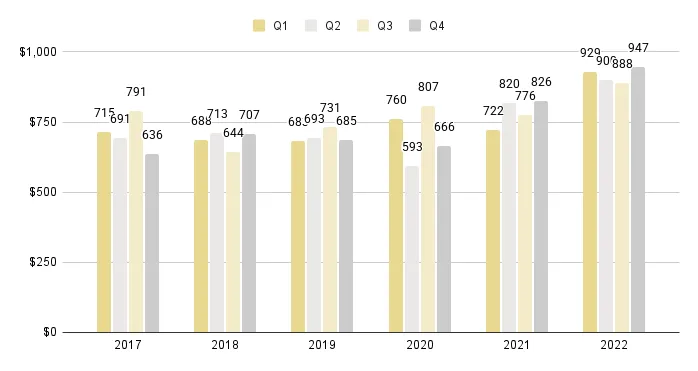
- Looking at the 5-year snapshot of quarterly prices per square foot below (Fig. 3), prices in this grouping closed Q4 at their highest ever - giving sellers excellent value for their luxury condo investments and confirming market health.
- Median Sales Price stayed mostly flat, adjusting only by -1.2%, slightly down from $2,025,000 in Q4 2021 to $2,000,000 in Q4 2022.
Miami Beach Quarterly Sales Price per Sq. Ft. 2017-2021 - Fig. 3
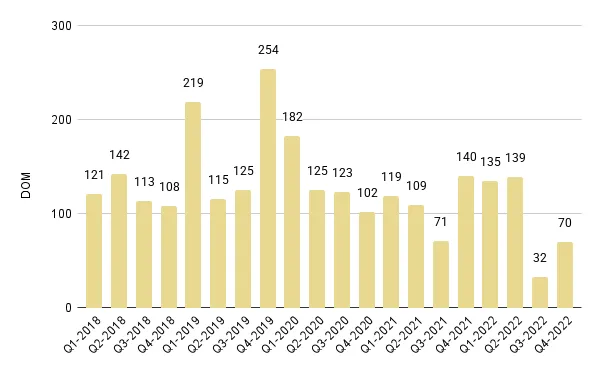
— Miami Beach: Days on Market Down Annually & YoY in Q4-22
Days on Market Down 17% on Annual Basis and 4.8% 4Q22-over-4Q21
Decreasing in step with the overall Miami luxury condo market statistics, and showing the health of the market, the Days on Market (DOM) for luxury condos in the Greater Miami Beach area dropped as follows:
- 2022 vs 2021. Days on Market declined 17%, with luxury condos taking 16 fewer days to sell compared to 2021. (Fig. 1a)
- Q4 2022 vs Q4 2021. Days on Market decreased 4.8%, indicating luxury condos spent 4 less days on market compared to the same quarter a year-ago. (Fig. 1.1)
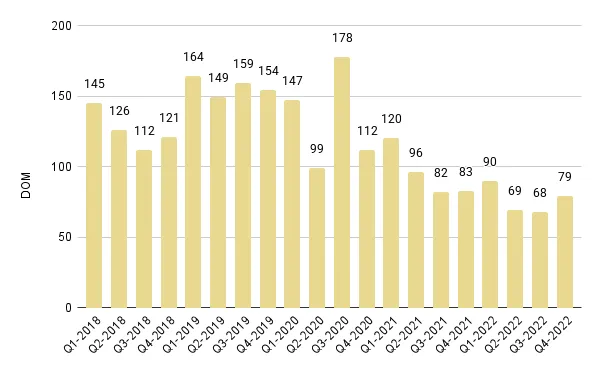
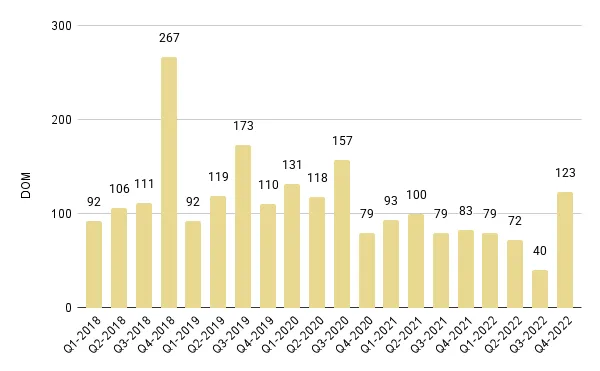
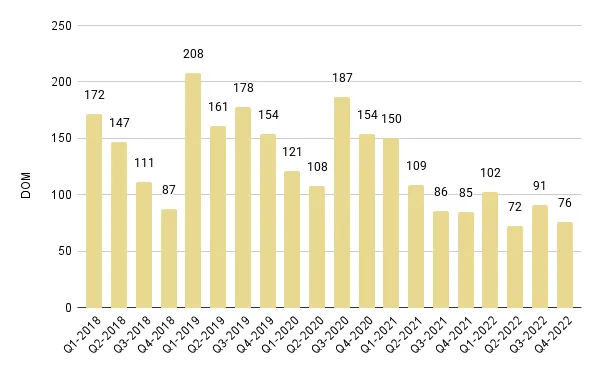
- Q4 2022 vs Q3 2022. Days on Market increased slightly in the last quarter of the year to 79 days from 68 days, however this is historically fairly usual. (Fig. 4)
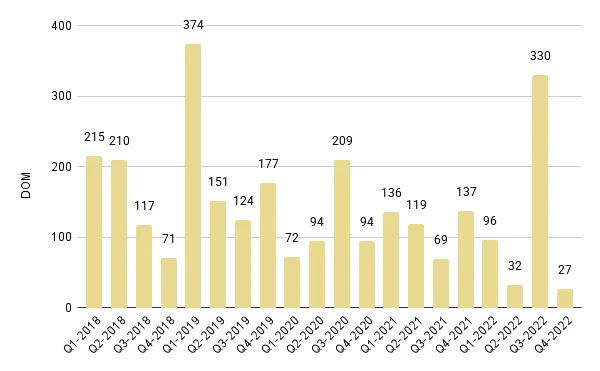
Miami Beach Area Quarterly Days on Market 2018-2022 – Fig. 4
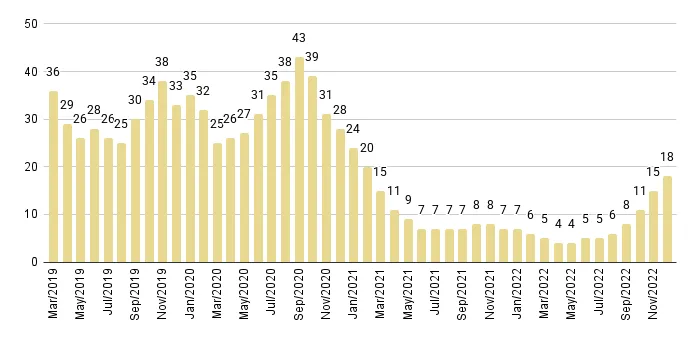
— Miami Beach: Q4 2022 Inventory Up YoY
Q4 2022 closed with 18 months of Inventory
Following 8 quarters of frenzied sales, it was quite expected that Inventory would increase as soon as the market took a break:
- On an annual basis, Inventory was up from 9 months in December 2021 to 18 months by year-end 2022 – reporting a 100% jump. (Fig. 5)
- On a quarter-over-quarter basis, inventory expanded from 9 months in September 2022 to 18 months in December – again reporting an uptick of 100%.
At 18 months, inventory closed above the 9-12-month range of an ideal market, making a theoretical shift into a buyer's market for the time being. As real estate experts, we expect this surplus to correct as soon as high season resumes in Spring 2023 and the luxury condo market to navigate 2023 as a balanced market – offering equal opportunity to buyers as well as sellers.
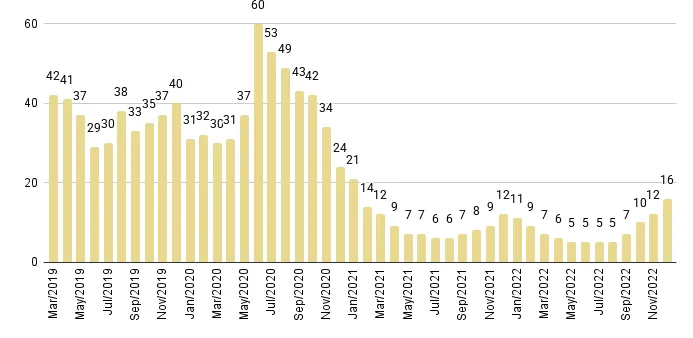
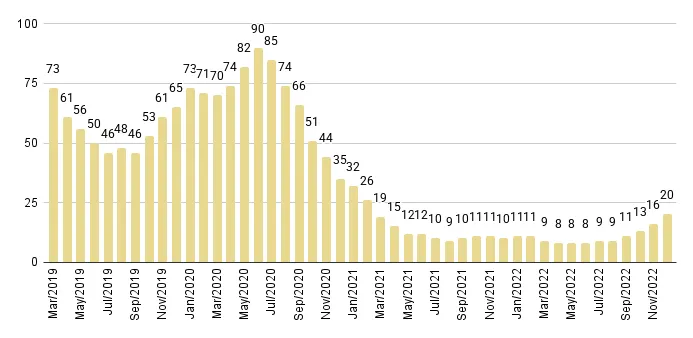
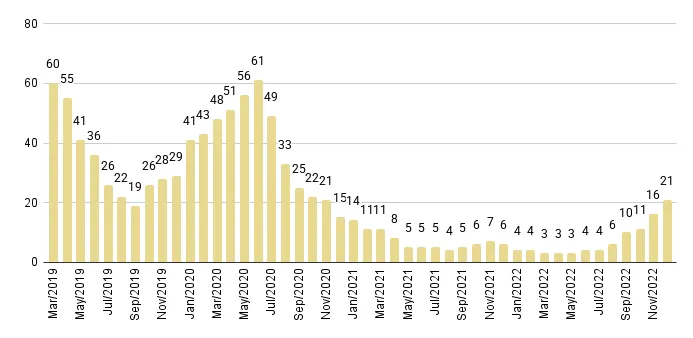
Miami Beach Months of Inventory from Mar. 2019 to Dec. 2022 - Fig. 5
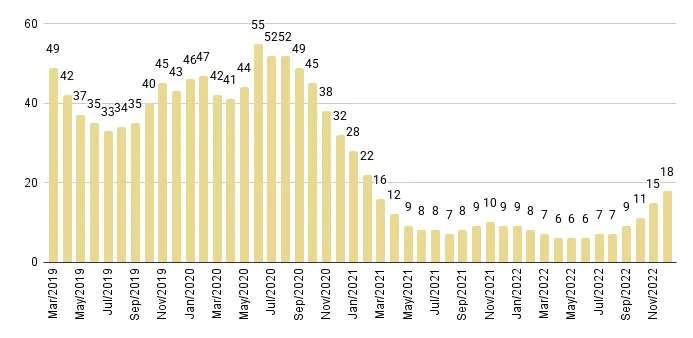
A balanced market has 9-12 months of inventory. The months of inventory are calculated as – number of active listings + number of pending listings, divided by the average number of deals in the last 6 months.
Looking for a market valuation on your Miami Beach condo? Call, chat, or email us for a FREE market evaluation of your property to make the most of this strong seller's market.
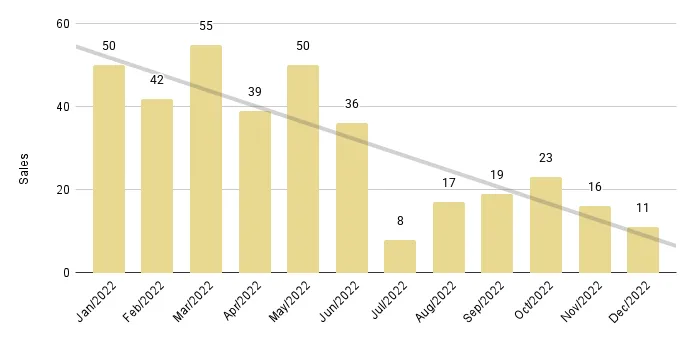
— Miami Beach Neighborhoods: Q4 2022 South Beach (ZIP 33139)
|
Q4 2022 vs Q3 2022 South Beach Luxury Condo Market Summary - Fig. 6 |
|||||||
|
Quarters |
Number of Sales |
% change in Sales |
Median Sale Price |
% change in Median Sale Price |
Median Sp/Sqft |
% change in Median Sp/Sqft |
Median of DOM |
|
Q4-2022 |
50 |
13.6% |
$2,000,000 |
4.7% |
$1,226 |
-6.9% |
87 |
|
Q3-2022 |
44 |
$1,910,000 |
$1,317 |
68 |
|||
|
Q4 2022 vs Q4 2021 South Beach Luxury Condo Market Summary – Fig. 6.1 |
|||||||
|
Quarters |
Number of Sales |
% change in Sales |
Median Sale Price |
% change in Median Sale Price |
Median Sp/Sqft |
% change in Median Sp/Sqft |
Median of DOM |
|
Q4-2022 |
50 |
-56.9% |
$2,000,000 |
7.5% |
$1,226 |
0.9% |
87 |
|
Q4-2021 |
116 |
$1,860,000 |
$1,216 |
63 |
|||
|
Annual 2022-over-2021 South Beach Luxury Condo Market Summary - Fig. 6a |
|||||||
|
Year |
Number of Sales |
% change in Sales |
Median Sale Price |
% change in Median Sale Price |
Median Sp/Sqft |
% change iMedian of DOM |
Median of DOM |
|
2022 |
366 |
-23.8% |
$2,000,000 |
-4.8% |
$1,270 |
2.8% |
69 |
|
2021 |
480 |
$2,100,000 |
$1,235 |
86 |
|||
— South Beach Luxury Condo Sales Stats: Annual + Q4 2022 Sales Down
Q4 2022 Sales down -56.9% Year-over-Year — Highest in a Fourth Quarter (2020 and Prior)
Consistent with the overall Miami luxury condo market trend for Q4 2022, South Beach reported a decrease but with an upside:
- Q4 2022 vs Q4 2021. Sales declined -56.9% year-over-year, down from 116 in Q4 2021 to 50 for the same quarter 2022. (Fig. 6.1)
- Q4 2022 still recorded higher sales than any previous fourth quarter in the years 2020 and before.
- Q4 2022 vs Q3 2022. Sales increased 13.6% quarter-over-quarter, up from 44 in the previous quarter to 50 in Q4 2022. (Fig. 6)
Annual 2022 Sales down -23.8% - Second-biggest Sales Year - Negative Trendline
Even with the market losing steam over the second half of 2022, South Beach reported its second strongest year in terms of sales, much like the overall Miami market trend:
- 2022 vs 2021. Sales decreased -23.8%, down from 480 annual sales in the record-setting year of 2021 to 366 in 2022. (Fig. 6a)
- With the second-highest annual sales ever, South Beach outperformed all previous years on record starting in 2020. (Fig. 7.1)
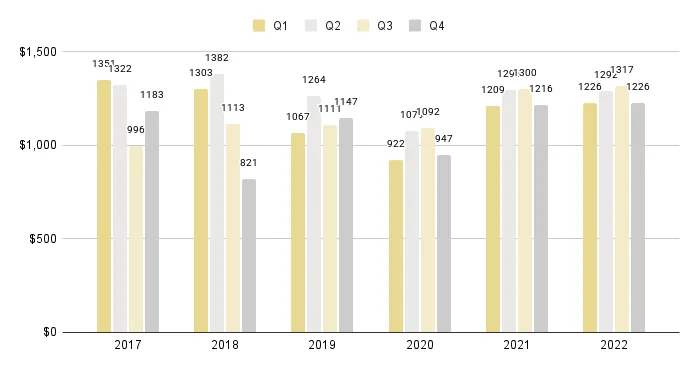
South Beach Luxury Condo Quarterly Sales 2015-2022 - Fig. 7.1
Owing to slower sales over the past three quarters, the 12-month Sales Trendline of Fig. 7.2 expectedly stayed negative from Q3 to Q4 2022.
2022 South Beach Luxury Condo 12-Month Sales with Trendline - Fig. 7.2
— South Beach Luxury Condo Price Trends: Mixed Annually + Q4 2022
Annual Price per Square Foot Flat at $1,270, Median Sales Price Down
Partly in line with the overall market trend of higher year-over-year annual price per square foot and flat Median Price, luxury condos in South Beach reported the following price statistics (Fig. 6a):
- Price per Square Foot stayed mostly flat, adjusting by 2.8%, slightly up from $1,235 in 2021 to $1,270 in 2022.
- Median Sales Price declined -4.8%, down from $2,100,000 in 2021 to $2,000,000 in 2022.
Inconsistencies in the Price Per Square Foot and Median Sales Price trends may be attributed to the sales of smaller amenity-rich luxury condos dominating the year, which tend to command higher prices per square foot.
Q4 2022 Price per Square Foot Flat at $1,226 — Median Sales Price Up Year-over-year
In contrast to the overall Miami market trend of higher quarterly Price per Square Foot and lower Median Price in Q4, South Beach reported the following (Fig. 6.1):
- Q4 2022 vs Q4 2021. Price per Square Foot stayed flat, adjusting by 0.9%, marginally up from $1,216 in Q4 2021 to $1,226 in Q4 this year.
- Looking at the 5-year snapshot of quarterly prices per square foot below (Fig. 8), we found that prices in South Beach closed in the higher ranges for a Q4 – offering sellers good value for their luxury condo investments.
- Median Sales Price increased 7.5%, up from $1,860,000 in Q4 2021 to $2,000,000 in Q4 2022.
South Beach Luxury Condo Quarterly Price per Square Foot 2017-2022 - Fig. 8
— South Beach: Days on Market Down Annually, Up YoY in Q4
Days on Market Down 20% on Annual Basis, Up 39% 4Q22-over-4Q21
Deviating partly from the overall market trend of lower Days on Market, luxury condos in South Beach reported a decline in 2022-over-2021 days, but increased in 4Q22-over-4Q21 trends:
- 2022 vs 2021. Days on Market decreased 20%, with luxury condos spending 17 fewer days on the market compared to 2021. (Fig. 6a)
- Q4 2022 vs Q4 2021. Days on Market increased 39%, showing luxury condos spent 24 more days on market in the fourth quarter compared to Q4 2021. (Fig. 6.1)
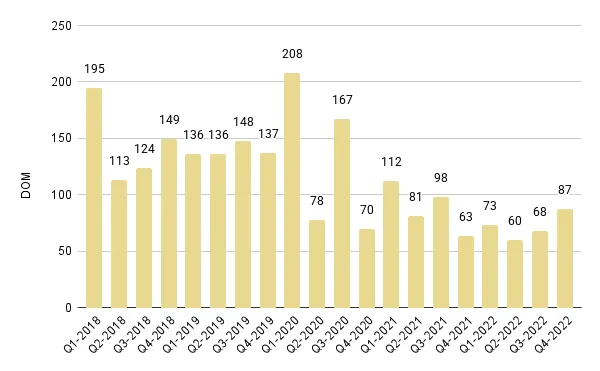
South Beach Luxury Condo Quarterly Days on Market 2018-2022 - Fig. 9
— South Beach: Luxury Condo Inventory Up YoY in 2022
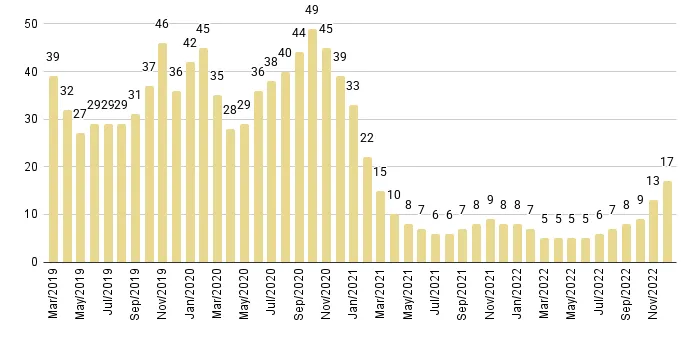
Q4 2022 Closed with 17 months of Inventory
Following the overall Miami market statistics and trends, luxury condo inventory in South Beach increased quarter-over-quarter, as well as year-over-year in Q4 2022. At 17 months, inventory closed above the 9-12-month mark of a balanced market – bringing the luxury condo market in this vacation hotspot to favor buyers until high season (Spring 2023) will likely clears off a chunk of the surplus.
- On an annual basis, Inventory was up from 8 months in December last year to 17 months in December 2022 – an 112.5% uptick. (Fig. 10)
- On a quarter-over-quarter basis, Inventory increased from 8 months in September 2022 to 17 months in December – again posting a 112.5% increase.
South Beach Months of Inventory from Mar. 2019 to Dec. 2022 - Fig. 10
— Miami Beach Neighborhoods: Q4 2022 Mid and North Beach (ZIP 33140 & 33141)
|
Q4 2022 vs Q3 2022 Mid-Beach and North-Beach Luxury Condo Market Summary - Fig. 11 |
|||||||
|
Quarters |
Number of Sales |
% change in Sales |
Median Sale Price |
% change in Median Sale Price |
Median Sp/Sqft |
% change in Median Sp/Sqft |
Median of DOM |
|
Q4-2022 |
24 |
-36.8% |
$1,475,000 |
-1.7% |
$1,131 |
-2.6% |
123 |
|
Q3-2022 |
38 |
$1,500,000 |
$1,162 |
40 |
|||
|
Q4 2022 vs Q4 2021 Mid-Beach and North-Beach Luxury Condo Market Summary - Fig. 11.1 |
|||||||
|
Quarters |
Number of Sales |
% change in Sales |
Median Sale Price |
% change in Median Sale Price |
Median Sp/Sqft |
% change in Median Sp/Sqft |
Median of DOM |
|
Q4-2022 |
24 |
-54.7% |
$1,475,000 |
-9.2% |
$1,131 |
14.4% |
123 |
|
Q4-2021 |
53 |
$1,625,000 |
$989 |
83 |
|||
|
Annual 2022-over-2021 Mid-Beach and North-Beach Luxury Condo Market Summary - Fig. 11a |
|||||||
|
Year |
Number of Sales |
% change in Sales |
Median Sale Price |
% change in Median Sale Price |
Median Sp/Sqft |
% change in Median Sp/Sqft |
Median of DOM |
|
2022 |
224 |
-18.2% |
$1,637,500 |
6.5% |
$1,064 |
12.1% |
69 |
|
2021 |
274 |
$1,537,500 |
$949 |
89 |
|||
— Mid-North Beach Luxury Condo Sales Trends: Most Resilient Market of Q4-22 in Miami Beach
Q4 2022 Sales Down -54.7% Year-over-year
Luxury condos in Mid-North Beach reported a decline in year-over-year sales, much in line with the overall Miami market trend for Q4 2022:
- Q4 2022 vs Q4 2021. Sales dropped -54.7% year-over-year, down from 53 in Q4 a year-ago to 24 in the same quarter of 2022. (Fig. 11.1)
- Q4 2022 vs Q3 2022. Sales decreased -36.8% quarter-over-quarter, down from 38 in Q3 2022 to 24 in Q4 2022. (Fig. 11)
- Still, Mid-North Beach topped the popularity charts in Miami Beach with the lowest percentage decline in year-over-year sales.
Annual Sales Down -18.2% — Second-Highest Annual Sales Ever — Negative Trendline
Echoing the overall Miami market trend, the luxury condo market in Mid-North Beach also reported its second-highest annual sales ever, even as momentum dropped significantly over the last two quarters (Fig. 12.1):
- 2022 vs 2021. Sales declined -18.2%, down from 274 annual sales in the record-setting previous year to 224 in 2022. (Fig. 11a)
- Outperforming all previous years on record, starting 2020, Mid-North Beach posted its second-biggest year for sales. (Fig. 12.1)
Mid-Beach and North-Beach Quarterly Sales 2015-2022 - Fig. 12.1
As explained above in this report, the 12-month Sales Trendline of Fig. 12.2 expectedly kept its negative trajectory between Q3 and Q4 of 2022 owing to a seasonal slowdown.
Mid-Beach and North-Beach 12-Month Sales with Trendline - Fig. 12.2
— Mid-North Beach Luxury Condo Price Trends: Up Annually + Mixed YoY in Q4 2022
Annual Price per Square Foot Up 12.1% to $1,064 — Median Sales Price Up
Almost in line with the overall market trend of higher year-over-year annual Price per Square Foot and a flat Median Price, luxury condos in Mid-North Beach reported the following increases (Fig. 11a):
- Price per Square Foot increased 12.1%, up from $949 in 2021 to $1,064 in 2022.
- Median Sales Price also increased 6.5%, up from $1,537,500 in 2021 to $1,637,500 in 2022.
Q4 2022 Price per Square Foot up 14.4% to $1,131 — Median Sales Price Down Year-over-year
Consistent with the overall Miami market trend of higher year-over-year Price per Square Foot and lower Median Price in Q4, Mid-North Beach reported the same (Fig. 11.1):
Q4 2022 vs Q4 2021
- Price per Square Foot increased 14.4%, up from $989 in Q4 2021 to $1,131 in Q4 this year.
- Median Sales Price decreased 9.2% to $1,475,000 in Q4 2022 from $1,625,000 in Q4 of 2021.
This variance in Price per Square Foot and Median Sales Price trends could be due to more sales of amenity-dense, smaller (in size) condos in the area that inherently command a higher price per square foot.
Looking at the 5-year snapshot of quarterly prices per square foot below (Fig. 13), we found that prices in Mid-North Beach closed in the higher ranges for Q4 – giving sellers top dollar for their luxury condo investments.
Mid-Beach and North-Beach Quarterly Price per Sq. Ft. 2017-2022 - Fig. 13
— Mid-North Beach: Days on Market Down Annually, Up YoY in Q4
Days on Market Down 22% on Annual Basis — Up 48% 4Q22-over-4Q21
Partly deviating from the overall market trend of lower Days on Market, Mid-North Beach reported a decline in 2022-over-2021 statistics but an increase in 4Q22-over-4Q21 numbers:
- 2022 vs 2021. Days on Market declined 22%, with luxury condos spending 20 fewer days on the market compared to 2021. (Fig. 11a)
- Q4 2022 vs Q4 2021. Days on Market increased 48%, indicating luxury condos spent 40 extra days on market compared to Q4 2021. (Fig. 11.1)
Mid-Beach and North-Beach Luxury Condo Quarterly Days on Market 2018-2022 – Fig. 14
— Mid-North Beach: Q4 2022 Inventory Up YoY — But Lowest in Greater Miami Beach
Q4 2022 closed with 16 months of Inventory
Consistent with the overall Miami market trend, luxury condo inventory in Mid-North Beach also increased quarter-over-quarter and year-over-year in Q4 2022:
- On an annual basis, inventory was up from 12 months in December 2021 to 16 months in December 2022 – an increase of 33.3%. (Fig. 15)
- On a quarter-to-quarter basis, inventory increased from 7 months in September 2022 to 16 months in December – posting a 128.6% increase.
At 16 months, Mid-North Beach reported the lowest year-end inventory of all the Miami Beach neighborhoods in our study. Year-end inventory closed above the 9-12-month mark of an ideal market – giving buyers a temporary edge until high season (Spring 2023) takes over to sweep off a chunk of the surplus – bringing the market into a balanced position for the rest of 2023.
Mid-Beach and North-Beach Months of Inventory from Mar. 2019 to Dec. 2022 - Fig. 15
A balanced market has 9-12 months of inventory. The months of inventory are calculated as – no. of active listings + no. of pending listings divided by the average number of deals in the last 6 months.
— Miami Beach Neighborhoods: Q4 2022 Surfside & Bal Harbour
|
Q4 2022 vs Q3 2022 Surfside & Bal Harbour Luxury Condo Market Summary - Fig. 16 |
|||||||
|
Quarters |
Number of Sales |
% change in Sales |
Median Sale Price |
% change in Median Sale Price |
Median Sp/Sqft |
% change in Median Sp/Sqft |
Median of DOM |
|
Q4-2022 |
18 |
-14.3% |
$2,225,500 |
-10.8% |
$1,028 |
-14.8% |
70 |
|
Q3-2022 |
21 |
$2,495,000 |
$1,207 |
32 |
|||
|
Q4 2022 vs Q4 2021 Surfside & Bal Harbour Luxury Condo Market Summary - Fig. 16.1 |
|||||||
|
Quarters |
Number of Sales |
% change in Sales |
Median Sale Price |
% change in Median Sale Price |
Median Sp/Sqft |
% change in Median Sp/Sqft |
Median of DOM |
|
Q4-2022 |
18 |
-63.3% |
$2,225,500 |
1.2% |
$1,028 |
-15.9% |
70 |
|
Q4-2021 |
49 |
$2,200,000 |
$1,222 |
140 |
|||
|
Annual 2022-over-2021 Surfside & Bal Harbour Luxury Condo Market Summary - Fig. 16a |
|||||||
|
Year |
Number of Sales |
% change in Sales |
Median Sale Price |
% change in Median Sale Price |
Median Sp/Sqft |
% change in Median Sp/Sqft |
Median of DOM |
|
2022 |
158 |
-25.8% |
$2,850,000 |
21.3% |
$1,292 |
27.6% |
87 |
|
2021 |
213 |
$2,350,000 |
$1,013 |
102 |
|||
— Surfside & Bal Harbour: Luxury Condo Sales Down – Annually & YoY
Q4 2022 Sales down -54.7% Year-over-year
In line with overall market trend for Q4 2022, luxury condos in Surfside & Bal Harbour reported a decline in year-over-year sales:
- Q4 2022 vs Q4 2021. Sales dropped -63.3% year-over-year, down from 49 in Q4 2021 to 18 in the same quarter of 2022. (Fig. 16.1)
- Q4 2022 vs Q3 2022. Sales decreased -14.3% quarter-over-quarter, down from 21 in the previous quarter to 18 in Q4 2022. (Fig. 16)
Annual Sales Down -25.8% — Still, Second-Biggest Sales Year — Negative Trendline
Following the overall Miami market trend, Surfside & Bal Harbour statistics showed the second-highest annual sales ever despite a seasonal pause over the second half (Fig. 17.1):
- 2022 vs 2021. Sales declined -25.8%, down from 213 annual sales in the record-setting year of 2021 to 158 in 2022. (Fig. 16a)
- Speaking to the market's health, annual sales in Surfside & Bal Harbour outperformed all previous years on record, starting 2020, to post the pairing's second-biggest sales year. (Fig. 17.1)
Surfside & Bal Harbour Quarterly Sales 2015-2022 - Fig. 17.1
As sales cooled further in this upscale pairing, the 12-month Sales Trendline of Fig. 17.2 expectedly kept negative between Q3 and Q4 2022.
Surfside & Bal Harbour 12-Month Sales with Trendline - Fig. 17.2
— Surfside & Bal Harbour: Luxury Condo Prices Up Annually – Second-Most Expensive in Miami Beach for 2022
Annual Price per Square Foot Up 27.6% to $1,292 — Median Sales Price Also Up
Partly in line with the overall market trend of higher year-over-year annual price per square foot and flat Median Price, luxury condos in Surfside & Bal Harbour reported the following increases (Fig. 16a):
- Price per Square Foot increased 27.6%, up from $1,013 in 2021 to $1,292 in 2022.
- At $1,292/square foot, luxury condos in Surfside & Bal Harbour emerged as the second-most expensive in Miami Beach, just behind Fisher Island priced at $1,903/square foot.
- Surfside & Bal Harbour (collectively) provided maximum value to sellers by reporting the highest percentage growth in 2022-over-2021 price per square foot.
- Median Sales Price also increased 21.3% to $2,850,000 in 2022 from $2,350,000 in 2021.
Q4 2022 Price per Square Foot Down 15.9% to $1,028 — Median Sales Price Flat Year-over-year
Partly deviating from the overall Miami market trend of higher year-over-year Price per Square Foot and lower Median Price, Surfside & Bal Harbour luxury condos reported the following price statistics (Fig. 16.1):
- Q4 2022 vs Q4 2021. Price per Square Foot declined by 15.9%, down from $1,222 in Q4 of the previous year to $1,028 in Q4 2022.
- Median Sales Price stayed mostly flat, adjusting by 1.2%, marginally up from $2,200,000 in Q4 of 2021 to $2,225,500 in Q4 2022.
Looking at the 5-year snapshot of quarterly prices per square foot below (Fig. 18), prices in Surfside & Bal Harbour closed in the mid-ranges for a Q4 – giving sellers fair value for their luxury condo investments in this upscale pairing.
Surfside & Bal Harbour Quarterly Price per Sq. Ft. 2017-2022 - Fig. 18
— Surfside & Bal Harbour: Days on Market Down Annually + YoY in 4Q-22
Days on Market Down 15% on Annual Basis, 50% drop 4Q22-over-4Q21
Declining in sync with the overall Miami luxury condo market trend, the Days on Market (DOM) for luxury condos in Surfside & Bal Harbour posted the following statistics:
- 2022 vs 2021. Days on Market declined 15%, with luxury condos spending 15 fewer days on the market compared to 2021. (Fig. 16a)
- Q4 2022 vs Q4 2021. Days on Market dropped 50%, showing that luxury condos spent 70 fewer days on the market compared to Q4 2021. (Fig. 16)
Surfside & Bal Harbour Quarterly Days on Market 2018-2022 – Fig. 19
— Surfside & Bal Harbour: Q4 2022 Luxury Condo Inventory Up YoY
Q4 2022 Closed with 18 months of Inventory
In step with the overall Miami market trend, luxury condo inventory in Surfside & Bal Harbour expectedly increased quarter-over-quarter as well as year-over-year:
- On an annual basis, inventory was up from 7 months in December last year to 18 months in December 2022 – a 157% uptick. (Fig. 20)
- On a quarter-over-quarter basis, inventory increased from 8 months in September 2022 to 18 months in December – reporting a 125% increase.
At 18 months, inventory closed above the standard 9-12-month mark of an ideal market – giving luxury condo buyers a temporary advantage until high season (spring 2023) kicks in to remove a sizable portion of this surplus – bringing the market to a balance for the rest of 2023.
Surfside & Bal Harbour Months of Inventory from Mar. 2019 to Dec. 2022 - Fig. 20
A balanced market has 9-12 months of inventory. The months of inventory are calculated as – no. of active listings + no. of pending listings divided by the average number of deals in the last 6 months.
If you are interested in buying or selling a condo in any of these Miami Beach neighborhoods, or would like more information about the data in our reports, please email us anytime or call (786) 655 - 4576.
— Miami Beach Neighborhoods: Q4 2022 Sunny Isles Beach
|
Q4 2022 vs Q3 2022 Sunny Isles Beach Luxury Condo Market Summary - Fig. 21 |
|||||||
|
Quarters |
Number of Sales |
% change in Sales |
Median Sale Price |
% change in Median Sale Price |
Median Sp/Sqft |
% change in Median Sp/Sqft |
Median of DOM |
|
Q4-2022 |
54 |
-33.3% |
$1,812,500 |
2.1% |
$947 |
6.6% |
76 |
|
Q3-2022 |
81 |
$1,775,000 |
$888 |
91 |
|||
|
Q4 2022 vs Q4 2021 Sunny Isles Beach Luxury Condo Market Summary - Fig. 21.1 |
|||||||
|
Quarters |
Number of Sales |
% change in Sales |
Median Sale Price |
% change in Median Sale Price |
Median Sp/Sqft |
% change in Median Sp/Sqft |
Median of DOM |
|
Q4-2022 |
54 |
-56.5% |
$1,812,500 |
-8.2% |
$947 |
14.7% |
76 |
|
Q4-2021 |
124 |
$1,975,000 |
$826 |
85 |
|||
|
Annual 2022-over-2021 Sunny Isles Beach Luxury Condo Market Summary - Fig. 21a |
|||||||
|
Year |
Number of Sales |
% change in Sales |
Median Sale Price |
% change in Median Sale Price |
Median Sp/Sqft |
% change in Median Sp/Sqft |
Median of DOM |
|
2022 |
462 |
-13.0% |
$1,800,000 |
2.9% |
$905 |
13.9% |
87 |
|
2021 |
531 |
$1,750,000 |
$795 |
100 |
|||
— Sunny Isles: Luxury Condo Sales Down – Most Popular Market of 2022 in Miami Beach
Q4 Sales Down -56.5% year-over-year — Highest in a Pre-pandemic 4th Quarter (2019 and prior)
Following the overall Miami market trend for Q4 2022, Sunny Isles Beach reported decreases but with a bright side:
- Q4 2022 vs Q4 2021. Sales declined -56.5% year-over-year, down from 124 in Q4 2021 to 54 for the same quarter 2022. (Fig. 21.1)
- Still, Q4 2022 reported the highest sales volume of any fourth quarter recorded in the year 2019 and from before – showing this oceanfront corridor for branded luxury condos has crossed a major growth threshold.
- Q4 2022 vs Q3 2022. Sales decreased 33.3% quarter-over-quarter, down from 81 in Q3 2022 to 54 in Q4 2022. (Fig. 21)
Annual Sales Down -13% — Second-highest Annual Sales Yet - Negative Trendline
Just like the overall Miami market, Sunny Isles Beach reported its second strongest year in terms of sales, despite momentum taking a pause during the second half of 2022:
- 2022 vs 2021. Sales declined -13%, down from 531 annual sales in the record-setting year of 2021 to 462 in 2022. (Fig. 21a)
- With the second-highest annual sales on record, Sunny Isles Beach outperformed all previous years, starting 2019. (Fig. 22.1)
- Sunny Isles Beach emerged as the most favored luxury condo market of 2022, posting the least negative impact (-13%) on 2022-over-2021 sales growth.
Sunny Isles Beach Luxury Condo Quarterly Sales 2015-2022 - Fig. 22.1
As explained previously in this report, the 12-month Sales Trendline of Fig. 22.2 expectedly remained negative from Q3 to Q4 2022 owing to a seasonal slowdown.
Sunny Isles Beach Luxury Condo 12-Month Sales with Trendline - Fig. 22.2
— Sunny Isles Luxury Condo Price Trends: Up Annually + Mixed YoY in 4Q 2022
Annual Price per Square Foot up 13.9% to $905 — Median Sales Price Flat
Consistent with the overall market trend of higher year-over-year annual price per square foot and a flat Median Price, luxury condos in Sunny Isles Beach reported the following price statistics (Fig. 21a):
- Price per Square Foot increased 13.9%, up from $795 in 2021 to $905 in 2022.
- Median Sales Price stayed mostly flat, adjusting 2.9%, slightly up from $1,750,000 in 2021 to $1,800,000 in 2022.
Q4 2022 Price per Square Foot Up 14.7% to Peak of $947 — Median Sales Price Down Year-over-year
Tightly in line with the overall Miami market trend of higher year-over-year Price per Square Foot and lower Median Price in Q4, Sunny Isles Beach reported the same (Fig. 21.1):
- Q4 2022 vs Q4 2021. Price per Square Foot increased by 14.7%, down from $826 in Q4 2021 to $947 in Q4 this year.
- Median Sales Price decreased 8.2%, down from $1,975,000 in Q4 2021 to $1,812,500 in Q4 2022.
Looking at the 5-year snapshot of quarterly prices per square foot below (Fig. 13), we found that prices in Sunny Isles Beach closed at an all-time high in Q4 2022 – giving sellers top dollar for their luxury condo investments in this beach town.
Sunny Isles Beach Quarterly Price per Sq. Ft. 2017-2022 - Fig. 23
— Sunny Isles: Days on Market Down Annually + YoY in Q4 2022
Days on Market Down 13% on Annual Basis, 10% for 4Q22-over-4Q21
Following the overall Miami luxury condo market trend, the Days on Market (DOM) for luxury condos in Sunny Isles Beach too posted declines:
- 2022 vs 2021. Days on Market declined 13%, with luxury condos spending 13 fewer days on the market compared to the previous year. (Fig. 21a)
- Q4 2022 vs Q4 2021. Days on Market declined 10%, with luxury condos spending 9 fewer days on the market compared to the same quarter 2021. (Fig. 21)
Sunny Isles Beach Quarterly Days on Market 2018-2022 – Fig. 24
— Sunny Isles Beach: Luxury Condo Inventory Up YoY 2022
Q4 2022 Closed with 20 months of Inventory
Comparable to the overall Miami market trend, luxury condo inventory in Sunny Isles Beach expectedly increased quarter-over-quarter, as well as year-over-year:
- On an annual basis, inventory was up from 10 months in December 2021 to 20 months in December 2022 – a 100% uptick. (Fig. 25)
- On a quarter-over-quarter basis, inventory increased from 11 months in September 2022 to 20 months in December – reporting an 81.8% increase.
At 20 months, inventory closed way above the 9-12-month benchmark of an ideal market – handing condo buyers the advantage until high season (Spring 2023) kicks in to wipe out a sizable portion of this surplus – hopefully recentering the market to a balanced position for the rest of 2023.
Sunny Isles Beach Months of Inventory from Mar. 2019 to Dec. 2022 - Fig. 25
A balanced market has 9-12 months of inventory. The months of inventory are calculated as – no. of active listings + no. of pending listings divided by the average number of deals in the last 6 months.
— Miami Beach Neighborhoods: Q4 2022 Fisher Island
|
Q4 2022 vs Q3 2022 Fisher Island Luxury Condo Market Summary - Fig. 26 |
|||||||
|
Quarters |
Number of Sales |
% change in Sales |
Median Sale Price |
% change in Median Sale Price |
Median Sp/Sqft |
% change in Median Sp/Sqft |
Median of DOM |
|
Q4-2022 |
6 |
100.0% |
$9,825,000 |
81.9% |
$2,584 |
40.8% |
27 |
|
Q3-2022 |
3 |
$5,400,000 |
$1,835 |
330 |
|||
|
Q4 2022 vs Q4 2021 Fisher Island Luxury Condo Market Summary - Fig. 26.1 |
|||||||
|
Quarters |
Number of Sales |
% change in Sales |
Median Sale Price |
% change in Median Sale Price |
Median Sp/Sqft |
% change in Median Sp/Sqft |
Median of DOM |
|
Q4-2022 |
6 |
-72.7% |
$9,825,000 |
113.6% |
$2,584 |
74.9% |
27 |
|
Q4-2021 |
22 |
$4,600,000 |
$1,477 |
137 |
|||
|
Annual 2022-over-2021 Fisher Island Luxury Condo Market Summary - Fig. 26a |
|||||||
|
Year |
Number of Sales |
% change in Sales |
Median Sale Price |
% change in Median Sale Price |
Median Sp/Sqft |
% change in Median Sp/Sqft |
Median of DOM |
|
2022 |
43 |
-55.2% |
$6,500,000 |
9.9% |
$1,903 |
28.5% |
69 |
|
2021 |
96 |
$5,915,000 |
$1,481 |
121 |
|||
— Fisher Island: Luxury Condo Sales Down Annually & YoY in 4Q-22; Prices Up
Q4 Sales Down -72.7% Year-over-year
Following the overall market trend in Miami, luxury condos in Fisher Island too reported a decline in year-over-year sales:
- Q4 2022 vs Q4 2021. Sales dropped -72.7% year-over-year, down from 22 in Q4 2021 to 6 in the same quarter of 2022. (Fig. 26.1)
- Q4 2022 vs Q3 2022. Sales increased 100% quarter-over-quarter, up from 3 in Q3 2022 to 6 in Q4 2022. (Fig. 26)
Annual Sales Down -18.2% — Negative Trendline
In line with the overall Miami market trend, the luxury condo market in Fisher Island too reported a decline in annual sales (Fig. 12.1):
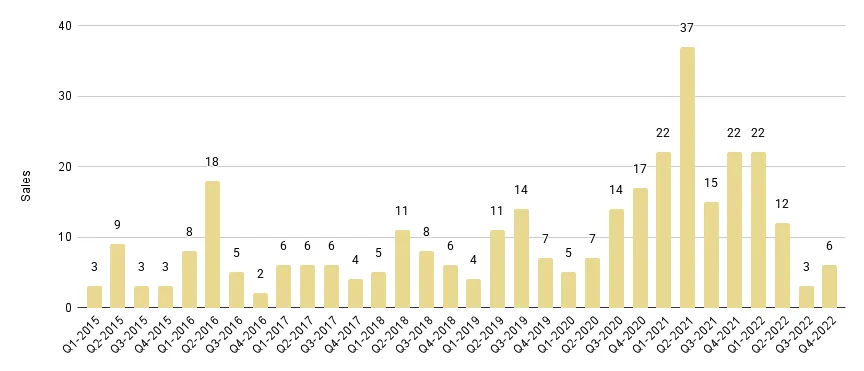
- 2022 vs 2021. Sales dipped -55.2%, down from 96 annual sales in the record-setting year of 2021 to 43 in 2022. (Fig. 26a)
Fisher Island Luxury Condo Quarterly Sales 2015-2022 - Fig. 27.1
Owing to the market cooling in anticipation of high season in spring of 2023, the 12-month Sales Trendline of Fig. 27.2 expectedly maintained its negative curve from Q4 2021 through to Q4 2022.
Fisher Island Luxury Condo 12-Month Sales with Trendline - Fig. 27.2
— Fisher Island: Luxury Condo Prices Up to Most Expensive in Miami – Leads Price Growth in Miami Beach
Annual Price per Square Foot up 28.5% to $1,903 — Median Sales Price Up
Partly deviating from the overall market trend of higher year-over-year annual Price per Square Foot and flat Median Price, luxury condos in Fisher Island reported the following increases (Fig. 26a):
- Price per Square Foot increased 28.5%, up from $1,481 in 2021 to $1,903 in 2022.
- At $1,903/square foot, luxury condos in Fisher Island remained the most expensive in Miami overall, followed by Surfside & Bal Harbour priced at $1,292/square foot.
- Fisher Island (along with Surfside & Bal Harbour) offered maximum value to sellers by recording the highest percentage growth in annual price per square foot.
- Median Sales Price also increased 9.9%, up from $5,915,000 in 2021 to $6,500,000 in 2022 – the most expensive zip code in all of Miami.
Q4 2022 Price per Square Foot up 74.9% to peak of $2,584 — Median Sales Price Up Year-over-year
Deviating partially from the overall Miami market trend of higher year-over-year Price per Square Foot and lower Median Price, luxury condos in Fisher Island reported the following price statistics (Fig. 26.1):
- Q4 2022 vs Q4 2021. Price per Square Foot increased by 74.9%, up from $1,477 in Q4 2021 to $2,584 in Q4 this year.
- Median Sales Price increased 113.6%, up from $4,600,000 in Q4 2021 to $9,825,000 in Q4 this year.
Looking at the 5-year snapshot of quarterly prices per square foot below (Fig. 18), prices in Fisher Island closed at an all-time high in Q4 – giving sellers excellent value for their luxury condo investments as well as keeping this the most expensive neighborhood in Miami.
Fisher Island luxury condos also reported the highest percentage growth in 4Q22-over-4Q21 Price per Square Foot of all the Miami neighborhoods in our overall study.
Fisher Island Quarterly Price per Sq. Ft. 2017-2022 - Fig. 28
— Fisher Island: Days on Market Down – Fastest-selling Market of Miami in Q4 2022
Days on Market Down 43% on Annual Basis and 81% for 4Q22-over-4Q21
In line with the overall Miami market trend of declining days on market, luxury condos in Fisher Island too reported the following:
- 2022 vs 2021. Days on Market declined 43%, with luxury condos spending 52 fewer days on the market compared to 2021. (Fig. 26a)
- Q4 2022 vs Q4 2021. Days on Market decreased 81%, with luxury condos spending 110 fewer days on the market compared to the same quarter of 2021. (Fig. 26.1)
With luxury condos taking only 27 days to sell in Q4 2022, listing to closing, Fisher Island emerged as the fastest-selling market in Miami Beach as well as overall Miami.
Fisher Island Quarterly Days on Market 2018-2022 – Fig. 29
— Fisher Island: Luxury Condo Inventory Up YoY to Highest in Miami Beach
Q4 2022 Closed with 21 months of Inventory
In sync with the overall Miami market trend, luxury condo inventory on Fisher Island increased by year-end:
- On an annual basis, inventory was up from 6 months in December 2021 to 21 months in December 2022 – an increase of 250%. (Fig. 30)
- On a quarter-over-quarter basis, inventory increased from 10 months in September 2022 to 21 months in December – reporting a 110% increase.
At 21 months, inventory closed way above the 9-12-month mark of a balanced market – giving condo buyers the edge until high season kicks in by spring 2023 to wipe out a majority of this surplus – keeping the market in equilibrium through the rest of 2023.
Looking to sell your luxury home in Fisher Island? Call, chat, or email for a FREE market evaluation of your property to make the most of this market.
Fisher Island Months of Inventory from Mar. 2019 to Dec. 2022 - Fig. 30
A balanced market has 9-12 months of inventory. The months of inventory are calculated as – no. of active listings + no. of pending listings divided by the average number of deals in the last 6 months.
— Q4 2022 Miami Beach Luxury Condo Market Conclusion
With the beach neighborhoods showing the first signs of a slowdown in Q2 2022, it was quite expected of this coastal district to close the year soft. Still, in a nod to general market health, annual sales in Miami Beach (collectively) surpassed those from 2020 and before – indicating that the market had not completely lost its steam and had expanded from its pre-pandemic era. And prices were generally up. Further, Days on Market generally decreased, showing healthy interest in these desirable waterfront neighborhoods.
Mid-North Beach remained the neighborhood of choice for luxury condo buyers in Q4 2022 - reporting the least negative impact (-55%) in a 4Q22-over-4Q21 sales analysis. On the other hand, Sunny Isles Beach topped popularity charts in a 2022-over-2021 sales analysis.
Echoing the overall Miami trend, the 12-month sales trendline remained negative across the board in Miami Beach, owing to a slow Q3 and Q4.
In terms of prices, Miami Beach, like the overall Miami trend, reported an increase in 2022-over-2021 as well as 4Q22-over-4Q21 Price per Square Foot – offering sellers good value for their luxury properties. As always, Fisher Island remained the most expensive zip code in Miami and Miami Beach – posting the highest Price per Square Foot of all time at $2,584 and highest Median Sales Price of $9.8 million. Further, in Q4 2022, Fisher Island led price growth trends in Miami Beach as well as Miami overall – offering sellers a great return on investment with an year-over-year increase of 75%.
Even with the market taking its usual pause over Q3 and Q4, the annual Days on Market declined across the board, like the overall market trend. In Q4 2022, the year-over-year Days on Market values declined in most parts of Miami Beach, much like the overall market trend – with only South Beach and Mid-North Beach reporting an increase.
As expected, Inventory went up across the board in the greater Miami Beach area, echoing the overall Miami trend. Mid-North Beach closed 2022 with the lowest levels (16) of inventory out of all the Miami Beach sub-neighborhoods under our review, while Fisher Island reported the highest levels (21 months).
Moving into high season of 2023, we, as real estate experts, expect the following factors to influence market trends:
- Known as a tax-saver's haven and a pro-business market, we expect wealth and business migration to continue boosting demand for generously-sized luxury condos in Miami, especially those on the beach.
- We expect more buyers and sellers to become active and enter the market as interest rates look to normalize.
- We expect our foreign buyer market share to increase in the near future, as Miami continues being a safe investment haven for buyers looking to escape harsh political winds back home and softening European economies.
- We expect inventory to correct back to a more balanced position as high season sets in over the course of late Spring/early Summer (considering Miami is a cyclical market with winter being its slowest and spring being its strongest seasons for sales).
- We expect more high net worth individuals to snap up a vacation condo or second/third homes in Miami, considering Miami's brand value is being recognized globally, (read this Knight Frank Report ranking Miami as the second "prime" real estate market in the world).
|
Q4-22 Trends |
Overall Miami |
Miami Beach |
South Beach |
Mid-North Beach |
Surfside & Bal Harbour |
Sunny Isles Beach |
Fisher Island |
|
Sales |
Down |
Down |
Down |
Down |
Down |
Down |
Down |
|
Trendline |
Negative |
Negative |
Negative |
Negative |
Negative |
Negative |
Negative |
|
Price per Sq. Ft |
Up |
Up |
Flat |
Up |
Down |
Up |
Up |
|
Days on Market |
Down |
Down |
Up |
Up |
Down |
Down |
Down |
|
Inventory |
Up |
Up |
Up |
Up |
Up |
Up |
Up |
|
2022 Annual Trends |
Overall Miami |
Miami Beach |
South Beach |
Mid-North Beach |
Surfside & Bal Harbour |
Sunny Isles Beach |
Fisher Island |
|
Sales |
Down |
Down |
Down |
Down |
Down |
Down |
Down |
|
Price per Sq. Ft |
Up |
Up |
Flat |
Up |
Up |
Up |
Up |
|
Days on Market |
Down |
Down |
Down |
Down |
Down |
Down |
Down |
Love what you see? Don't forget to share our blog and subscribe (see the subscribe link on the top menu) to receive the latest market news in your inbox. And also follow us on social media @condoblackbook. Thanks so much!
Questions or comments about the stats? Interested in browsing the market? Contact Sep at sniakan (at) blackbookproperties.com or call 305-725-0566.