
Seaside Villas


15111-15923 Fisher Island Dr, Fisher Island, FL 33109
About
Seaside Villas
Building key details


Do you own in Seaside Villas?
Our condo sales experts and premier marketing team can help you sell your place for top dollar.

Building Amenities


Additional details
Seaside Villas floorplans
Seaside Villas building stats

Seaside Villas building stats
Sales stats
Key averages for the building
$1,850,000
$2,681
N/A*
*past six months
N/A*
*past six months
N/A*
Avg Days on Market
*past six months
Sales history
Number of sold condos by month
Request info
Neighborhood Comparisons
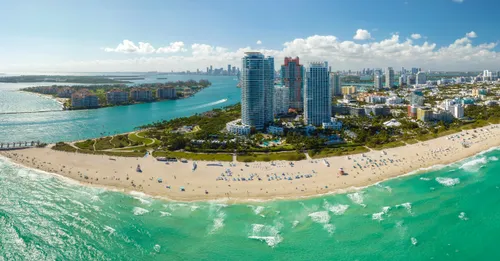
South of Fifth
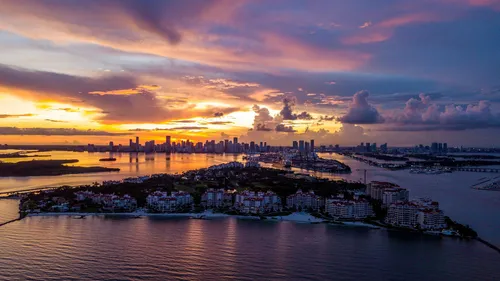
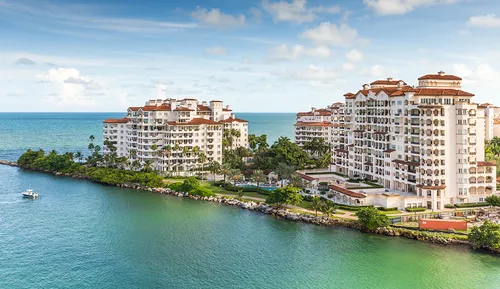
Fisher Island
The Best Miami Neighborhoods: South of Fifth vs Fisher Island
If you’re considering moving to Miami, and you’re looking for an exclusive, beachfront, luxury neighborhood, two options you’ll likely hear suggested are South of Fifth (SoFi) in South Beach, or the ultra-exclusive Fisher Island. These two areas share some geographic and lifestyle similarities—both are incredibly beautiful neighborhoods that are home to affluent and high net worth (HNW) residents seeking a relaxed but sophisticated waterfront lifestyle with large condo home options—but they also have essential differences that make for very different living experiences. In this blog, we’ll dive deeper into both neighborhoods and their buildings, comparing what makes them stand out in several categories, and why residents choose them. This way, you’ll be well-informed to make a confident decision as to where to start your property search or tell your luxury agent when choosing between South of Fifth vs Fisher Island. ## The Lifestyle South of Fifth or “SoFi,” as it is known locally, is the area of South Beach located south of Fifth Street. It’s the southernmost tip of the island of Miami Beach and offers a lovely, upscale lifestyle and more luxurious properties than the rest of South Beach or Miami Beach for that matter. Most of its desirability comes from being a highly walkable neighborhood surrounded by water while keeping a more serene vibe than the more tourist-friendly lifestyle that the rest of South Beach is known for. ###### SoFi or South of Fifth - Miami Beach, FL Now, although SoFi is an exclusive area by virtue of home prices, Fisher Island is far more exclusive than SoFi because it is its own island accessible only by boat, helicopter, or ferry. In fact, Fisher Island is the most affluent zip code in the entire United States, with median household incomes in the millions. It is also characterized by being a small community. The island is under one square mile in size, and has a population of about 600 people, many of whom use their homes only part of the year as vacation or second homes—a key differentiator when comparing South of Fifth vs Fisher Island lifestyles. ###### Fisher Island. This dynamic results in great privacy for its residents, making Fisher Island a popular choice among VIPs, with celebrities like Oprah, Julia Roberts, Karolina Kurkova, Boris Becker and Caroline Wozniacki having called it home at some point. ## Getting Around SoFi is a highly walkable neighborhood, with everything you need within a short distance from every residence, making car-free living a reality. Also, since it’s part of South Beach, it benefits from having multiple transportation options available, including Miami Beach’s free trolley service, Miami Dade buses—including the Miami Beach Airport Express—, and Citi Bike. If you’re a car owner, moving around is also a breeze, with the MacArthur Causeway being your main way in and out of Miami Beach. To move around the neighborhood, you might take Alton Road on the west side, or the iconic Collins Ave, which runs northbound all the way up through the island. ###### Fisher Island Ferry. Photo courtesy of Fisher Island Club. Fisher Island, on the other hand, is so small that the most popular methods of transportation within the island are golf carts, bicycles, or your plain old feet. The island is completely private—only residents and their guests are allowed in—and accessible only by ferry, helicopter, or boat. To get to and from Fisher Island, most residents drive their cars to Terminal Island and board the ferry, which departs every 10 minutes on weekdays during morning rush hour and every 15 minutes all other times, 24 hours a day. Others access the island via private yachts. ## The Work-Life Flow Because they are primarily residential neighborhoods, neither SoFi nor Fisher Island is an area where you’ll find a lot of commercial business activity, making each retain a distinctly residential feel. However, SoFi has some boutique hotels, a few small private offices, fitness centers and spas, and exclusive establishments, including some of the finest restaurants in Miami and Miami Beach—a perk that often comes up when people consider living in South of Fifth vs living on Fisher Island. Fisher Island has a far less commercial life with only a small bank, post office, and grocery store on the island. The Fisher Island Club and Resort is the only real business in the area, with its small golf course, several restaurants, a market, a marina, a tennis club, and a spa. There is also a fire rescue station and a medical center on the island. ## Outdoor Living & Waterfronts Both have incredible park areas, open access to the water, a marina and beaches. They are truly exceptional neighborhoods to enjoy the unbeatable outdoor lifestyle and weather that South Florida has to offer. The heart of the SoFi community is the beautiful South Pointe Park, where the Atlantic Ocean meets the waters of Biscayne Bay and Government Cut, where the cruise ships head out to port. The park offers direct beach access for swimming and snorkeling, as well as fishing from the South Pointe Pier, and you can kayak, paddle board, and jet ski from the marina on the west side of the neighborhood. It also features beautifully landscaped paths, a large children’s playground with water features, a cafe and juice bars, and a Smith & Wollensky restaurant, where you can sit outside and watch the boats come in and out. The park is also a favorite of dog lovers, yoga practitioners, and those just seeking to spend some time outdoors. On Fisher Island, waterfront residences surround a small, but competitive 9-hole golf course designed by P.B. Dye, and the Fisher Island Spa Club and Resort provides 17 tennis courts featuring all four Grand Slam surfaces, plus 4 pickleball courts. There is a small natural area for bird-watching and one mile of private beach graced with imported, powdery white sand. There are also two deep-water marinas. ## Arts & Culture If you live in SoFi, you’ll have easy access to all of the cultural offerings in South Beach (and Downtown Miami for that matter), including: * The yearly Art Basel fair at the Miami Beach Convention Center in South Beach and all of Art Week Miami * The South Beach Wine and Food Festival * Fashion Week Miami * Several other music, art, and street festivals Beyond the events, South Beach is also home to iconic venues like the Fillmore Miami Beach at the Jackie Gleason Theater, which hosts a diverse lineup of concerts, comedy shows, and live performances, as well as other entertainment places of smaller scale and art galleries. And the Frank Gehry-designed New World Center, home to the New World Symphony. All of Downtown Miami’s cultural and sporting venues, like the Perez Art Museum Miami, the Arsht Center for the Performing Arts, the Frost Science Museum and the Kaseya Center are all a 10-minute drive over the causeway from SoFi. Fisher Island on its own has no public festivals or venues because it is so private and its residents prefer it this way. It has the Vanderbilt Theater at the Fisher Island Club, and its residents may occasionally hold private parties that include live entertainment by well-known celebrities. If you want to venture out to mainland events, you will have to take the ferry to the causeway, or travel by boat or helicopter. For both neighborhoods, cultural life is tied to their proximity to South Beach and Downtown Miami, where residents can enjoy the same festivals and events. The only difference is that SoFi residents can return home more quickly and easily after a night out, while Fisher Island residents have a slightly longer commute, relying on the ferry service or their private yacht as transportation. ## The Shopping Edit Being mostly residential, neither SoFi nor Fisher Island is particularly renowned for its shopping options. However, this doesn’t mean there isn’t any retail offering. South of Fifth provides a charming and curated shopping experience with several boutiques selling unique fashion, artisanal goods, and accessories. For everyday essentials, there’s a Publix a block away from Fifth Street, as well as a Target, a Best Buy, and a Walgreens. Whole Foods is also about 5 blocks away on 10th Street. And then you are only about another mile away to a Trader Joe’s and Fresh Market. The Lincoln Road pedestrian shopping mall will be your closest shopping, whether you are living on Fisher Island or in SoFi. So there is little difference there. On the island, Fisher Island’s shopping is much more exclusive and limited due to its private island status. Retail options here are mainly the boutiques within the Fisher Island Hotel and the island’s private club, selling luxury resort wear, fine jewelry, and exclusive designer items. For everyday items, residents rely on the in-island grocery store or private delivery services. For a wider range of shopping options, residents of both neighborhoods would have to venture out to mainland Miami or into Bal Harbour, which would require a 20-30 minute drive. ## Signature Flavors Although South of Fifth is a low-key neighborhood where you can bypass the hustle and bustle that characterizes South Beach, the area is home to some of the finest restaurants in all of in all of Greater Miami, and in some cases, the world: * The famous Joe's Stone Crab Restaurant has been a Miami Beach icon for decades * The South Pointe Tavern serves up food and drink fit for celebrities * Stubborn Seed, one of Miami’s Michelin-starred restaurants, allows you to taste the creativity of one of Miami’s top chefs * Azabu Miami, located inside the Stanton Hotel, serves exquisite Japanese cuisine * Call Me Gaby is where locals stop by for comforting pizza, pies, and pasta * Nikki Beach is best known for its amazing brunch menu, followed by a haute club scene * Carbone Miami serves Italian fare along with cocktails and wine in an opulent environment Fisher Island, on the other hand, doesn’t have any restaurants open to the general public, but the club’s seven restaurants all have excellent reputations. Among the most popular eateries on the island are: * Fisher Island Beach Club Restaurant * Porto Cervo * Garwood Lounge * Theapolis & Library * Snooker Club * Greenside * La Trattoria ## Top Schools SoFi residents are served by South Pointe Elementary School, Nautilus Middle School, and Miami Beach Sr. High, all of which are highly ranked public schools. Still, many residents may prefer to send their children to local private schools such as St. Patrick’s and the Hebrew Academy, located in Miami Beach, or to private schools located on mainland Miami. ###### Hebrew Academy. Photo courtesy of the Hebrew Academy. Fisher Island is also served by Miami Beach public and private schools, but the Fisher Island Day School is a small private elementary school exclusively for island residents, serving about 150 students in kindergarten through 8th grade (K-8 students). Contact us for specific school recommendations if you are considering either of these neighborhoods. ## Architecture & Design South of Fifth, similarly to the rest of South Beach, is characterized by a blend of beautifully restored Art Deco buildings from the 30s, 40s, and 50s, and a selection of modern luxury condo towers ranging in architectural styles from sleek minimalism to Mediterranean-inspired design. One common thread across all condos is that they feature top-tier amenities such as multiple pools, state-of-the-art fitness centers, concierge services, and on-site spas, with some offering panoramic ocean views with direct beach access. Some of the most luxurious condos on South of Fifth include: * 321 Ocean Drive, a modernist-designed boutique enclave, featuring only 21 exclusive residences. * Apogee South Beach, renowned for its artistic interiors by Yabu Pushelberg and top-of-the-line amenities. * Ocean House, Art Deco restored building with 28 residences and beachfront access. * Continuum South Beach North and South Towers, iconic beachfront towers with expansive units and resort-style amenities. If you’re looking to buy a pre-construction instead, the upcoming Villa Sofia Residences is the only development in the area, offering 27 modern residences, allowing short-term rentals. Fisher Island, on the other hand, is known for its single-family-sized condo residences, almost like condo mansions, private villas, and super-exclusive multi-family condo towers designed for privacy. The residences often feature oversized terraces, multiple balconies, and ample interior spaces. Some of the projects on the island include: * Palazzo del Mare, * Palazzo del Sol, and * Palazzo della Luna, which are the most recent constructions. The island’s only new development is The Residences at Six Fisher Island, an ultra-luxury, 10-story boutique tower offering just 50 units with expansive floor plans and ultra-exclusive amenities. View all currently available properties for South of Fifth to find your perfect condo. ## Prices & Perspective The average listing price for South Beach residences is about $788,389, or $512 per square foot; however, listings in South of Fifth tend to run higher than that, with some of the highest-priced properties reaching around $33,990,000, or $45,320 per square foot. Meanwhile, Fisher Island residences list for an average of about $5,567,078, or $1,489 per square foot, while the most luxurious properties can reach $50,000,000 or about $5,338 per square foot. Another factor to consider when making the South of Fifth vs Fisher Island cost consideration is HOA fees. In Fisher Island, these can go anywhere from $3,500 to $7,000 per month, while South of Fifth’s HOA fees are significantly lower. And you will want to be a member of the Fisher Island Club to enjoy living there, which has membership fees and dues. Additionally, part of your HOA fees living on the island pay for your ferry service. Discover all available Fisher Island properties and find your perfect condo. ## Which is the Better Choice? South of Fifth or Fisher Island? While both SoFi and Fisher Island provide an upscale lifestyle with exclusive privileges and perks, the two neighborhoods attract different residents, mainly based on how much privacy and exclusivity you may desire. If you dream of or need a very private resort living with golf and yachting as the center of your world, you may fall in love with Fisher Island. But if you prefer more accessibility and a laid-back lifestyle with easy access to urban offerings, we definitely recommend South of Fifth. So, whether you’re considering South Beach’s South of Fifth or Fisher Island, or evaluating Miami’s many other neighborhoods, our team has over 20 years of expertise in Miami’s luxury condo market, which makes us the ideal choice to help you find the right Miami property for you. --- _Let us get to know your preferences, desires, and budget and direct you to the most suitable neighborhoods and listings while sharing with you our knowledge and expertise of Miami and the South Florida area._ **LET'S GET SOCIAL!** Connect with us on Instagram and Youtube.
Real Estate News
Market Insights
Market Reports
Miami Beach
Mid Beach
South Beach
Sunny Isles Beach
Surfside
North Beach
Fisher Island
Q4 2021 Miami Beach Luxury Condo Market Report - Triple Digit Sales Growth
View the most up-to-date market reports. Take me there now! South Beach remained the most popular neighborhood in Miami Beach for Q4 2021 as well as the year 2021\. Maintaining a record-setting pace throughout the year, luxury condos in Miami Beach closed 2021 with triple-digit sales growth (annual basis) owing to intense demand by domestic and international buyers in this coastal district. In terms of prices, Miami Beach as a whole gained in year-over-year value - offering sellers great returns on their luxury condos. Fisher Island reigned supreme throughout 2021, keeping its status as the most expensive zip code in this coastal district. Overall, the Days on Market declined and Months of Inventory stayed low, showing how a seller's market has now established its stronghold in these waterfront neighborhoods. This, coupled with real-time observations into buyer behavior at the beginning of 2022, it's quite obvious that the luxury condo market in Miami has crossed a major maturity threshold in terms of sales volume and prices, with minimal chances of tracing back to 2020 or even pre-pandemic levels. Read on for more year-over-year insights in our exclusive and detailed analysis on how each Miami Beach neighborhood fared against each other, as well as against the overall Miami luxury condo trends in Q4 2021 and on an annual basis in 2021. For the purposes of this report, the "Miami Beach" neighborhoods include the sub-neighborhoods of South Beach, Mid-Beach, North-Beach, Sunny Isles Beach, Surfside, Bal Harbour, and Fisher Island as part of our Miami Beach grouping. Also, this luxury condo submarket report only features properties priced at $1 million and above. **2021 Annual Miami Beach + Sub-neighborhood Luxury Condo Market Highlights:** * **Annual Sales up 218.9%** against 2020, also highest since 2015 * Annual Price per Square Foot up to $997 in 2021-over-2020 analysis * Annual Days on Market dropped 26% in 2021-over-2020 analysis * _**Winners**_: South Beach (305%) and Sunny Isles Beach (227%) top popularity charts, lead annual sales growth in Miami Beach * _**Winner**_: Fisher Island leads price growth in Miami overall with highest percentage increase in Price per Square Foot – offering maximum value to sellers * _**Winner**_: Fisher Island is also the most expensive neighborhood of 2021 with a median price of $1,481/sq. ft., closely followed by South Beach at $1,235/sq. Ft. * _**Most Opportunity**_: Mid-North Beach neighborhood showed the highest inventory and lowest increase in sales growth with a drop in Median Sales Price * 2021 closed as a strong seller's market **Q4 2021 - Miami Beach Luxury Condo Market Highlights:** * Sales up 89.9% year-over-year, post highest sales in a 4th-quarter in over 6 years * 12-month sales trendline down from positive in Q3 to negative in Q4 2021 * At $1,029, Price per Square Foot up 29% in 2021-over-2020 analysis * Days on Market down 25.9% year-over-year * Inventory down 71.9% year-over-year to 9 months **Q4 2021 - Miami Beach Sub-neighborhood Highlights:** * _**Winner Sales Growth**_: South Beach (192%) tops popularity charts, leads quarterly sales growth in Miami Beach * 12-month sales trendline negative across the board - except Sunny Isles Beach * _**Winner Price/SF**_: Surfside & Bal Harbour post highest percentage growth in year-over-year price per sq. ft. (88%) in Miami Beach, replacing Fisher Island from top spot in Q3 2021 * _**Winner Median Price**_: Fisher Island continues as the most expensive neighborhood in Q4 2021 with a median price of $1,477/sq. ft. * Sunny Isles Beach posts biggest percentage decline (44%) in **Days on Market** in Miami Beach * Fisher Island reports the lowest year-end **Inventory** (6 months) in Miami Beach and second-lowest of all Miami neighborhoods * Mid-North Beach posts highest year-end **Inventory** (12 months) in Miami Beach **Miami Beach Luxury Condo Markets at a Glance - Q4 2021 YoY (Number of Sales)** **Miami Beach Overall Luxury Condo Markets at a Glance - Q4 2021 YoY (Median Sale Price)** **Miami Beach Luxury Condo Markets at a Glance - Q4 2021 YoY (Median Sales Price / SqFt)** ## Table of Contents 1. Overall Q4 2021 Miami Beach Luxury Condo Market Trends 2. Q4 2021 South Beach Luxury Condo Market Trends 3. Q4 2021 Mid and North Beach Luxury Condo Market Trends 4. Q4 2021 Surfside & Bal Harbour Luxury Condo Market Trends 5. Q4 2021 Sunny Isles Beach Luxury Condo Market Trends 6. Q4 2021 Fisher Island Luxury Condo Market Trends 7. Conclusion - Q4 2021 Miami Beach Luxury Condo Market Report **Q4 2021 Miami Beach Luxury Condo Market Summary - Fig. 1** **Quarters** **Number of Sales** **% change in Sales** **Median Sale Price** **% change in Median Sale Price** **Median Sp/Sqft** **% change in Median Sp/Sqft** **Median of DOM** **Q4-2021** 357 89.9% $2,000,000 23.1% $1,029 29.0% 83 **Q4-2020** 188 $1,625,000 $797 112 **2021-over-2020 Miami Beach Luxury Condo Annual Market Summary - Fig. 1.1** **Year** **Number of Sales** **% change in Sales** **Median Sale Price** **% change in Median Sale Price** **Median Sp/Sqft** **% change in Median Sp/Sqft** **Median of DOM** **2021** 1588 218.9% $2,000,000 15.9% $997 18.0% 94 **2020** 498 $1,725,000 $845 127 ## Miami Beach: Highest Luxury Condo Sales Volume – Annual + Q4 Sales ### Q4 Sales up 89.9% year-over-year - highest sales in a 4th quarter. Reporting phenomenal progress compared to all previous years under review (Fig. 2.1), luxury condos in the Miami Beach area reported their highest sales volume in a fourth-quarter. Contributing to the skyrocketing sales trend seen in the overall Miami report for Q4 2021, sales were almost twice those in the same quarter of 2020 or even the pre-pandemic market of 2019. * **Q4 2021 vs Q4 2020**. Sales increased 89.9% year-over-year, up from 181 in Q4 2020 to 357 for the same quarter 2021\. (Fig. 1) * Sunny Isles Beach was the highest contributor in terms of volume (122 sales), while South Beach was the highest percentage contributor (192% YoY) to the sales growth reported in Miami Beach. * Even with luxury condo sales cooling off after peaking in Q2 (as they usually do in Miami), Q4 sales closed 12.3% higher than those in Q3 2021 – picking up pace after steadily declining from April to September. With travel bans being lifted and Art Basel pulling in international crowds, Miami Beach (much like overall Miami) reported its best December yet, closing the year on a record-setting note. ### Annual Sales up 218.9% - highest in over 6 years - negative trendline. As expected of a year reporting record-breaking sales for each passing quarter, Miami Beach posted its highest annual sales seen in over 6 years of our reporting. The total sales volume in 2021 (1588 annual sales) was an impressive 218.9% higher than that in 2020 (498 annual sales). Annual sales were also significantly higher than any other previous year on our record (Fig. 2.1). However, due to declining sales from April through September, the 12-month Sales Trendline of Fig. 2.2 closed with a downward trend for the first time in five quarters. The sales trendline had maintained an upward trajectory from Q4 2020 through to Q3 2021\. As luxury condo experts, we will be keeping a close watch on sales performance in the Miami Beach area compared to Greater Downtown in Q1 2022 to report on the popularity trends of luxury home buyers. **Miami Beach Luxury Condo Quarterly Sales 2015-2021 - Fig. 2.1** **Miami Beach Luxury Condo Monthly Sales from Jan. 2016 to Dec. 2021 - Fig. 2.2** **Miami Beach Luxury Condo 12-Month Sales with Trendline - Fig. 2.3** ## Miami Beach: Luxury Condo Prices Up ### Annual Price/Square Foot up to $997, Median Sales Price also up Tightly in line with the overall market trend of higher year-over-year prices, luxury condos in Miami Beach also reported increases – showing a great uptick in value for sellers in the area (Fig. 1.1): * Price per Square Foot increased 18%, up from $845 in 2020 to $997 in 2021. * Median Sales Price also increased 15.9%, up from $1,725,000 in 2020 to $2,000,000 in 2021. ### Q4 2021 Price/Square Foot up 29% to $1,029, Median Sales Price also up year-over-year Again in line with the overall market trend of higher year-over-year prices for Q4 2021, sellers received great value for their luxury condos in Miami Beach (Fig. 1): * Price per Square Foot increased by 29%, up from $797 in Q4 2020 to $1,029 for the same quarter 2021 – closing in the higher ranges compared to 2017-2020 (Fig. 3). * Median Sales Price also increased 23.1%, up from $1,625,000 in the last quarter 2020 to $2,000,000 in Q4 2021. **Miami Beach Quarterly Sales Price per Sq. Ft. 2017-2021 - Fig. 3** ## Miami Beach: Days on Market Down Annually & YoY ### Days on Market down -26% on annual basis and -25.9% 4Q21-over-4Q20 Owing to intense buyer demand, the Days on Market (DOM) in Miami Beach declined in line with the overall Miami luxury condo market trend: * 2021 vs 2020. Days on Market dropped 26%, revealing luxury condos spent 33 fewer days on market compared to 2020 (Fig. 1.1). * Q4 2021 vs Q4 2020. Days on Market declined 25.9%, showing luxury condos spent 29 fewer days getting sold compared to Q4 2020 – also closing Q4 2021 with the lowest DOM in 4 years (Fig. 4). **Miami Beach Quarterly Days on Market 2018-2021 – Fig. 4** ## Miami Beach: Inventory Down – Seller's Market Strengthens ### Q4 2021 closes with 9 months of Inventory With the beaches still holding their appeal for both domestic and international buyers, luxury condo inventory in the area closed with the lowest year-end values seen in over 6 years. At 9 months, inventory stayed within the 9-12 month range of a balanced market, putting sellers in control of negotiations and the market (as opposed to the buyer-friendly climate we've reported for more than 6 years). On an annual basis, inventory dropped from 32 months in December 2020 to 9 months at year-end 2021 – a decline of 71.9%. Compared to pre-pandemic levels, inventory was down 79% from 62 months in December 2019 (Fig. 5). On a quarter-over-quarter basis, inventory was slightly up from 8 months in September 2021 to 9 months in December – an uptick of 12.5%. Considering Miami Beach inventory is very tight, as luxury condo experts we recommend buyers to put in strong offers (preferably above the asking price to be able to close on their desired home in this highly competitive market). **Miami Beach Months of Inventory from Mar. 2019 to Dec. 2021 - Fig. 5** _A balanced market has 9-12 months of inventory. The months of inventory are calculated as – number of active listings + number of pending listings, divided by the average number of deals in the last 6 months._ --- #### Looking for a market valuation on your Miami Beach condo? Call, chat, or email us for a FREE market evaluation of your property to make the most of this strong seller's market. --- ## Q4 2021 Miami Beach Neighborhoods: South Beach (ZIP 33139) **Q4 2021 South Beach Luxury Condo Market Summary - Fig. 6** **Quarters** **Number of Sales** **% change in Sales** **Median Sale Price** **% change in Median Sale Price** **Median Sp/Sqft** **% change in Median Sp/Sqft** **Median of DOM** **Q4-2021** 114 192.3% $1,850,000 15.6% $1,207 27.4% 63 **Q4-2020** 39 $1,600,000 $947 70 **2021-over-2020 South Beach Luxury Condo Annual Market Summary - Fig. 6.1** **Year** **Number of Sales** **% change in Sales** **Median Sale Price** **% change in Median Sale Price** **Median Sp/Sqft** **% change in Median Sp/Sqft** **Median of DOM** **2021** 478 305.1% $2,100,000 23.5% $1,235 20.4% 86 **2020** 118 $1,700,000 $1,026 99 ## South Beach: Luxury Condo Sales Up - Lead Annual & 4Q Sales Growth in Miami Beach ### Q4 Sales up 192.3% year-over-year - highest percentage growth in Miami Beach Leading sales growth in Miami Beach, South Beach reported the highest percentage year-over-year increase of all neighborhoods under review. * **Q4 2021 vs Q4 2020.** Sales jumped 192.3% year-over-year, up from 39 in Q4 2020 to 114 for the same quarter 2021\. (Fig. 6) * Even with sales taking a breather during the winter months (as they usually do in Miami), South Beach reported its highest fourth quarter sales in more than 6 years (Fig. 7.1) – 37.3% higher quarter-over-quarter against Q3 2021, 192.3% higher year-over-year, and 225.7% higher than those in Q4 2019 (pre-pandemic). * Compared to all other neighborhoods under review in our overall Miami report, South Beach posted the third-highest growth percentage, just behind Edgewater (350%) and Brickell (395%). ### Annual Sales up 305.1% - highest percentage growth in Miami Beach - negative trendline Leading sales growth in Miami Beach and reporting the third-highest percentage growth in Miami overall – behind Edgewater (545%) and Brickell (345%) – South Beach maintained its status as a leading market for luxury condos in Miami Beach. * **2021 vs 2020.** Sales increased 305.1%, up from a total of 118 sales in 2020 to an impressive 478 sales in 2021\. (Fig. 6.1) * These are also the highest recorded annual sales in South Beach in the 6+ years of our reporting. Even with buyer demand staying strong throughout the year, the 12-month Sales Trendline of Fig. 7.2 dipped to a negative trajectory, due to declining sales from April through August. The trendline had remained positive from Q4 2020 to Q3 2021. **South Beach Luxury Condo Quarterly Sales 2015-2021 - Fig. 7.1** **South Beach Luxury Condo 12-Month Sales with Trendline - Fig. 7.2** ## South Beach: Luxury Condo Price per Square Foot Up YoY ### Annual Price/Square Foot up to $1,235, Median Sales Price also up Consistent with the overall Miami market trend of year-over-year gains, luxury condos in South Beach also reported price increases (Fig. 6.1): * Price per Square Foot increased 20.4%, up from $1,026 in 2020 to $1,235 in 2021. * At $1,235, this popular beach destination closed with the second-highest price/square foot in Miami Beach, behind Fisher Island. * Median Sales Price also increased 23.5%, up from $1,700,000 in 2020 to $2,100,000 in 2021. ### Q4 2021 Price/Square Foot up 27.4% to $1,207, Median Sales Price also up year-over-year In line with the overall market trend of higher year-over-year prices, sellers in South Beach received great value for their luxury condos (Fig. 6): * Price per Square Foot increased by 27.4%, up from $947 in Q4 2020 to $1,207 for the same quarter 2021 – closing in the higher ranges compared to 2017-2020 (Fig. 8). * Median Sales Price also increased 15.6%, up from $1,600,000 in the last quarter of 2020 to $1,850,000 in Q4 2021. **South Beach Luxury Condo Quarterly Price per Square Foot 2017-2021 - Fig. 8** ## South Beach: Days on Market Down Annually & YoY ### Days on Market down -13% on annual basis and -10% 4Q21-over-4Q20 Owing to great buyer-seller communication, the Days on Market (DOM) in South Beach decreased just like in the overall Miami luxury condo market trend: * **2021 vs 2020.** Days on Market declined 13%, showing luxury condos spent 13 fewer days on market compared to 2020\. (Fig. 6.1) * **Q4 2021 vs Q4 2020.** Days on Market decreased 10%, showing luxury condos spent 7 fewer days on the market against Q4 2020 – also closing Q4 2021 with the lowest DOM since 2018 (Fig. 9). **South Beach Luxury Condo Quarterly Days on Market 2018-2021 - Fig. 9** ## South Beach: Inventory Down YoY ### Q4 2021 closes with 8 months of Inventory Consistent with the overall Miami trend, luxury condo inventory in South Beach decreased year-over-year but increased quarter-over-quarter. At 8 months, inventory was below the 9-12-month benchmark of a balanced market, further strengthening the seller-friendly climate in South Beach. On an annual basis, inventory dropped from 39 months in December 2020 to 8 months year-end 2021 – a 79.5% dip. Compared to pre-pandemic levels, inventory was down 77.8% from 36 months in December 2019 (Fig. 10). On a quarter-over-quarter basis, inventory was marginally up from 7 months in September to 8 months in December 2021. **South Beach Months of Inventory from Mar. 2019 to Dec. 2021 - Fig. 10** ## Q4 2021 Miami Beach Neighborhoods: Mid and North Beach (ZIP 33140 & 33141) **Q4 2021 Mid-Beach and North-Beach Luxury Condo Market Summary - Fig. 11** **Quarters** **Number of Sales** **% change in Sales** **Median Sale Price** **% change in Median Sale Price** **Median Sp/Sqft** **% change in Median Sp/Sqft** **Median of DOM** **Q4-2021** 49 36.1% $1,550,000 \-5.3% $982 14.1% 78 **Q4-2020** 36 $1,637,500 $861 79 **2021-over-2020 Mid-Beach and North-Beach Luxury Condo Annual Market Summary - Fig. 11.1** **Year** **Number of Sales** **% change in Sales** **Median Sale Price** **% change in Median Sale Price** **Median Sp/Sqft** **% change in Median Sp/Sqft** **Median of DOM** **2021** 270 193.5% $1,525,000 8.9% $944 11.1% 87 **2020** 92 $1,400,000 $850 123 ## Mid-North Beach: Luxury Condo Sales Up – Annually + YoY ### Q4 Sales up 36.1% year-over-year – highest 4th-quarter sales in 6 years Luxury condos in Mid-North Beach posted their highest sales volume in a fourth-quarter, in sync with the overall market trend in Miami. * **Q4 2021 vs Q4 2020.** Sales increased 36.1% year-over-year, up from 36 in Q4 2020 to 49 in Q4 2021\. (Fig. 11) * Even with sales cooling off after a summertime peak (a standard pattern for the cyclical market in Miami), Q4 sales closed 4.2% higher than those in Q3 2021 – picking up pace by year-end after steadily declining from June through September. * This segment of Miami Beach represents the best entry to the market. ### Annual Sales up 193.5% - highest in over 6 years - negative trendline. Reporting unprecedented sales throughout the year, much like the overall market trend in Miami, this Mid-North Beach grouping reported its highest annual sales in over 6 years. The total sales volume in 2021 (270 annual sales) was 66% higher than that of 2020 (92 annual sales). Total annual sales were also significantly higher than any other previous year on our record (Fig. 12.1). However, due to declining sales from June through September, the 12-month Sales Trendline of Fig. 12.2 closed 2021 with a downward trajectory. Previously, the sales trendline had kept positive from Q4 2020 to Q3 2021. **Mid-Beach and North-Beach Quarterly Sales 2015-2021 - Fig. 12.1** **Mid-Beach and North-Beach 12-Month Sales with Trendline - Fig. 12.2** ## Mid-North Beach Luxury Condo Price Trends: Up Annually + Mixed YoY in 4Q 2021 ### Annual Price/Square Foot up to $944, Median Sales Price also up Consistent with the overall market trend of higher year-over-year prices, luxury condos in Mid-North Beach increased, offering sellers good value for their luxury condos (Fig. 11.1): * Price per Square Foot increased 11.1%, up from $850 in 2020 to $944 in 2021. * Median Sales Price too posted an uptick of 8.9%, up from $1,400,000 in 2020 to $1,525,000 in 2021. ### Q4 2021 Price/Square Foot up 14.1% to $982, Median Sales Price down year-over-year Deviating from the overall Miami market trend of higher year-over-year prices, Mid-North Beach posted an increase in its year-over-year Price per Square Foot but declined in Median Price: * Price per Square Foot increased 14.1%, up from $861 in Q4 2020 to $982 in Q4 2021 – closing the year in the mid range compared to 2017-2020 (Fig. 13) * Median Sales Price declined by -5.3%, down from $1,627,500 in Q4 2020 to $1,550,000 for same quarter 2021. This variance in Price per Square Foot and Sales Price trends could be due to higher sales volume of smaller (in size), amenity-dense condos in the area that inherently command a higher price per square foot. **Mid-Beach and North-Beach Quarterly Price per Sq. Ft. 2017-2021 - Fig. 13** ## Mid-North Beach: Days on Market Down Annually & YoY ### Days on Market down -29% on annual basis and flat 4Q21-over-4Q20 Mostly in line with the overall Miami market trend of lower days on market, buyers and sellers closed deals sooner in Mid-North Beach: * **2021 vs 2020.** Days on Market declined 29%, showing luxury condos spent 36 fewer days on market compared to 2020\. (Fig. 11.1) * **Q4 2021 vs Q4 2020.** Days on Market stayed flat year-over-year, as luxury condos spent only 1 less day on the market compared to Q4 2020. * However, the DOM closed Q4 2021 at a new low in more than 4 years (Fig. 14). **Mid-Beach and North-Beach Luxury Condo Quarterly Days on Market 2018-2021 – Fig. 14** ## Mid-North Beach: Inventory Down YoY – But Highest in Miami Beach ### Q4 2021 closes with 12 months of Inventory. Just as the overall Miami market trend, luxury condo inventory in Mid-North Beach declined year-over-year but increased quarter-over-year. At 12 months, inventory was within the 9-12-month benchmark of a balanced market, keeping the market seller-friendly in the neighborhood. On an annual basis, inventory dropped by half from 24 months in December 2020 to 12 months in December 2021\. Compared to the pre-pandemic market, inventory was down 70% from 40 months in December 2019 (Fig. 15). On a quarter-over-quarter basis, inventory was 71.4% up from 7 months in September. Mid-North Beach also recorded the highest luxury condo inventory in Miami Beach and the third-highest in overall Miami, just behind Downtown Miami (15) and Edgewater (12) – giving buyers a brief advantage, with more choices, in this quieter part of the beach. **Mid-Beach and North-Beach Months of Inventory from Mar. 2019 to Dec. 2021 - Fig. 15** A balanced market has 9-12 months of inventory. The months of inventory are calculated as – no. of active listings + no. of pending listings divided by the average number of deals in the last 6 months ## Q4 2021 Miami Beach Neighborhoods: Surfside & Bal Harbour **Q4 2021 Surfside & Bal Harbour Luxury Condo Market Summary - Fig. 16** **Quarters** **Number of Sales** **% change in Sales** **Median Sale Price** **% change in Median Sale Price** **Median Sp/Sqft** **% change in Median Sp/Sqft** **Median of DOM** **Q4-2021** 49 81.5% $2,200,000 33.3% $1,222 87.9% 140 **Q4-2020** 27 $1,650,000 $651 102 **2021-over-2020 Surfside & Bal Harbour Luxury Condo Annual Market Summary - Fig. 16.1** **Year** **Number of Sales** **% change in Sales** **Median Sale Price** **% change in Median Sale Price** **Median Sp/Sqft** **% change in Median Sp/Sqft** **Median of DOM** **2021** 213 156.6% $2,350,000 \-3.7% $1,013 20.3% 102 **2020** 83 $2,441,000 $842 130 ## Surfside & Bal Harbour: Luxury Condo Sales Up – Annually & YoY ### Q4 Sales up 81.5% year-over-year – highest 4th-quarter sales since 2015 Luxury condos in Surfside & Bal Harbour reported the highest sales volume in a fourth-quarter, consistent with the overall market trend in Miami. * **Q4 2021 vs Q4 2020.** Sales increased 81.5% year-over-year, up from 27 in Q4 2020 to 49 in Q4 2021\. (Fig. 16) * Even as sales took a seasonal break, declining from May through September, Q4 sales closed 36.1% higher than those in Q3 2021, closing the year on a strong note. ### Annual Sales up 156.6% - highest in over 6 years - negative trendline. Supported by unprecedented sales momentum throughout the year, like the overall market trend in Miami, this Surfside & Bal Harbour grouping posted its highest annual sales in over 6 years of our reporting. The total sales volume in 2021 (213 annual sales) was 156.6% higher than that of 2020 (83 annual sales). Sales (annual) were also significantly higher than any other previous year on our record (Fig. 17.1). Even with good momentum through the year, the 12-month Sales Trendline of Fig. 17.2 closed on a downward trend as volumes declined consistently from May through September. Previously, the trendline had stayed positive from Q4 2020 to Q3 2021. **Surfside & Bal Harbour Quarterly Sales 2015-2021 - Fig. 17.1** **Surfside & Bal Harbour 12-Month Sales with Trendline - Fig. 17.2** ## Surfside & Bal Harbour: Luxury Condo Prices Mixed Annually + Up YoY in 4Q 2021 ### Annual Price/Square Foot up to $1,013, Median Sales Price down Partly deviating from the overall Miami market trend of higher year-over-year prices, luxury condos in Surfside & Bal Harbour reported an increase in Price/Square Foot but declined in Median Price (Fig. 16.1): * Price per Square Foot increased 20.3%, up from $842 in 2020 to $1,013 in 2021. * Median Sales Price dropped by -3.7%, down from $2,441,000 in 2020 to $2,350,000 in 2021. This contradiction in Price per Square Foot and Sales Price trends could be due to more sales of smaller (in size), amenity-rich condos in the combined neighborhood that tend to command a higher price per square foot. ### Q4 2021 Price/Square Foot up 87.9% to $1,222, Median Sales Price up year-over-year Consistent with the overall Miami market trend of higher year-over-year prices, Surfside & Bal Harbour also reported increases: * Price per Square Foot increased 87.9%, up from $651 in Q4 2020 to $1,222 in Q4 2021\. With an 88% increase, this combined neighborhood offered the best year-over-year value to sellers in Miami Beach (Fig. 18). * Median Sales Price increased by 33.3%, up from $1,650,000 in Q4 2020 to $2,200,000 for the same quarter 2021. **Surfside & Bal Harbour Quarterly Price per Sq. Ft. 2017-2021 - Fig. 18** ## Surfside & Bal Harbour: Days on Market Down Annually, Up YoY in 4Q-21 ### Days on Market down -22% on annual basis, but up 37% 4Q21-over-4Q20 Partly deviating from the overall Miami market trend of lower days on market, Surfside & Bal Harbour reported an increase in year-over-year numbers in Q4 2021: * **2021 vs 2020.** Days on Market declined -22%, showing luxury condos spent 28 fewer days on market compared to 2020 (Fig. 16.1). * **Q4 2021 vs Q4 2020.** Days on Market increased 37%, showing luxury condos spent 38 extra days on the market compared to Q4 2020 (Fig. 16). **Surfside & Bal Harbour Quarterly Days on Market 2018-2021 – Fig. 19** ## Surfside & Bal Harbour: Luxury Condo Inventory Down YoY ### Q4 2021 closes with 7 months of inventory Mostly in tune with the overall Miami market trend, luxury condo inventory in Surfside & Bal Harbour declined year-over-year but stayed flat quarter-over-year. At 7 months, inventory was below the 9-12-month benchmark of a balanced market, showing that a seller's market has found its footing in this combined neighborhood. On an annual basis, inventory dropped by 75% from 28 months in December 2020 to 7 months in December 2021\. Compared to pre-pandemic levels, inventory was down an impressive 78.8% from 33 months in December 2019 (Fig. 20). On a quarter-over-quarter basis, inventory stayed put at 7 months. **Surfside & Bal Harbour Months of Inventory from Mar. 2019 to Dec. 2021 - Fig. 20** A balanced market has 9-12 months of inventory. The months of inventory are calculated as – no. of active listings + no. of pending listings divided by the average number of deals in the last 6 months. ### If you are interested in buying or selling a condo in any of these Miami Beach neighborhoods, or would like a valuation of your condo property, please email us anytime or call (786) 655-4576. ## Q4 2021 Miami Beach Neighborhoods: Sunny Isles Beach **Q4 2021 Sunny Isles Beach Luxury Condo Market Summary - Fig. 21** **Quarters** **Number of Sales** **% change in Sales** **Median Sale Price** **% change in Median Sale Price** **Median Sp/Sqft** **% change in Median Sp/Sqft** **Median of DOM** **Q4-2021** 122 76.8% $2,000,000 42.9% $831 24.8% 87 **Q4-2020** 69 $1,400,000 $666 154 **2021-over-2020 Sunny Isles Beach Luxury Condo Annual Market Summary - Fig. 21.1** **Year** **Number of Sales** **% change in Sales** **Median Sale Price** **% change in Median Sale Price** **Median Sp/Sqft** **% change in Median Sp/Sqft** **Median of DOM** **2021** 529 226.5% $1,760,000 14.7% $795 12.2% 100 **2020** 162 $1,535,000 $709 153 ## Sunny Isles: Luxury Condo Sales Up - Highest Volume in Miami Beach ### Q4 Sales up 76.8% year-over-year - highest fourth-quarter sales in over 6 years Establishing itself as a leading market for luxury condos in Miami Beach, Sunny Isles Beach reported the highest sales volume of all neighborhoods under review (see Markets at a Glance - Q4 2021 YoY chart up top). * **Q4 2021 vs Q4 2020**. Sales increased 76.8% year-over-year, up from 69 in Q4 2020 to 122 in Q4 2021 (Fig. 21). * Even as sales took a seasonal break (declining over Q3 and Q4), Sunny Isles Beach reported its highest fourth quarter sales volume in over 6 years (Fig. 22.1) – more than 4 times those in Q4 2019 (pre-pandemic). ### Annual Sales up 226.5% - highest growth in 6 years - positive trendline This popular beach town, loaded with branded luxury condos, reported its highest annual sales in the 6+ years of our reporting. Sales soared 226.5%, up from a total of 162 sales in 2020 to an unprecedented 529 sales in 2021 (Fig. 21.1). Owing to fewer dips and bigger highs, Sunny Isles Beach was the only neighborhood in Miami Beach to report a positive 12-month Sales Trendline in Q4 2021 (Fig. 22.2). Sales in this beach town maintained their upward trajectory for five straight quarters – from Q4 2020 through to Q4 2021. **Sunny Isles Beach Luxury Condo Quarterly Sales 2015-2021 - Fig. 22.1** **Sunny Isles Beach Luxury Condo 12-Month Sales with Trendline - Fig. 22.2** ## Sunny Isles: Luxury Condo Prices Up ### Annual Price/Square Foot up to $795, Median Sales Price also up Consistent with the overall Miami market trend of year-over-year gains, luxury condos in Sunny Isles Beach reported price increases (Fig. 21.1): * Price per Square Foot increased 12.2%, up from $709 in 2020 to $795 in 2021. * Median Sales Price too increased 14.7%, up from $1,535,000 in 2020 to $1,760,000 in 2021. ### Q4 2021 Price/Square Foot up 24.8% to a peak of $831, Median Sales Price also up year-over-year Again consistent with the overall market trend of higher year-over-year prices, sellers in Sunny Isles Beach received excellent value for their luxury condos (Fig. 21): * Price per Square Foot increased by 24.8%, up from $666 in Q4 2020 to $831 for the same quarter 2021 – closing at its highest in over 5 years (Fig. 23). * Median Sales Price also increased an incredible 42.9%, up from $1,400,000 in the last quarter of 2020 to $2,000,000 in Q4 2021. **Sunny Isles Beach Quarterly Price per Sq. Ft. 2017-2021 - Fig. 23** ## Sunny Isles: Days on Market Down ### Days on Market down -35% on annual basis and down -44% 4Q21-over-4Q20 Echoing the overall Miami market trend of lower days on market, buyers and sellers in Sunny Isles Beach reached an understanding sooner on deals: * 2021 vs 2020. Days on Market declined 35%, showing luxury condos spent 53 fewer days on market compared to 2020 (Fig. 21.1). * Q4 2021 vs Q4 2020. Days on Market dropped 44% year-over-year, showing luxury condos spent 67 fewer days getting sold compared to Q4 2020. **Sunny Isles Beach Quarterly Days on Market 2018-2021 – Fig. 24** ## Sunny Isles: Luxury Condo Inventory Down YoY ### Q4 2021 closes with 10 months of inventory Mostly consistent with the overall Miami market trend, luxury condo inventory in Sunny Isles Beach decreased year-over-year but stayed flat quarter-over-year. At 10 months, inventory was within the 9-12 months range of a balanced market, showing that a seller's market sustained in this branded luxury corridor. On an annual basis, inventory dropped by 71.4% from 35 months in December 2020 to 10 months in December 2021\. Compared to pre-pandemic levels, inventory was down an incredible 84.6% from 65 months in December 2019 (Fig. 20). On a quarter-over-quarter basis, inventory stayed flat at 10 months. **Sunny Isles Beach Months of Inventory from Mar. 2019 to Dec. 2021 - Fig. 25** A balanced market has 9-12 months of inventory. The months of inventory are calculated as – no. of active listings + no. of pending listings divided by the average number of deals in the last 6 months. ## Q4 2021 Miami Beach Neighborhoods: Fisher Island **Q4 2021 Fisher Island Luxury Condo Market Summary - Fig. 26** **Quarters** **Number of Sales** **% change in Sales** **Median Sale Price** **% change in Median Sale Price** **Median Sp/Sqft** **% change in Median Sp/Sqft** **Median of DOM** **Q4-2021** 22 29.4% $4,600,000 \-9.4% $1,477 30.9% 137 **Q4-2020** 17 $5,075,000 $1,128 94 **2021-over-2020 Fisher Island Luxury Condo Annual Market Summary - Fig. 26.1** **Year** **Number of Sales** **% change in Sales** **Median Sale Price** **% change in Median Sale Price** **Median Sp/Sqft** **% change in Median Sp/Sqft** **Median of DOM** **2021** 96 123.3% $5,915,000 30.0% $1,481 40.6% 121 **2020** 43 $4,550,000 $1,054 108 ## Fisher Island: Luxury Condo Sales Up Annually & YoY ### Q4 Sales up 29.4% year-over-year – highest 4th-quarter sales Consistent with the overall market trend in Miami, luxury condos in Surfside & Bal Harbour reported the highest sales volume in a fourth-quarter: * **Q4 2021 vs Q4 2020.** Sales increased 29.4% year-over-year, up from 17 in Q4 2020 to 22 in Q4 2021\. (Fig. 26) * Even as sales took a cyclical break (as they do in Miami), declining from April through September, Q4 sales closed 46.7% higher than those in Q3 2021, closing the year on a strong note. ### Annual Sales up 123.3% - highest in over 6 years - negative trendline. Like the overall market trend in Miami, Fisher Island posted its highest annual sales in over 6 years of our reporting. The total sales volume in 2021 (96 annual sales) was 123.3% higher than that of 2020 (43 annual sales). Sales (annual) were also significantly higher than any other previous year under review (Fig. 27.1). Owing to sales declining from April to September, the 12-month Sales Trendline of Fig. 27.2 went from a flat-to-positive in Q3 2021 to close with a negative trajectory in Q4 2021. **Fisher Island Luxury Condo Quarterly Sales 2015-2021 - Fig. 27.1** **Fisher Island Luxury Condo 12-Month Sales with Trendline - Fig. 27.2** ## Fisher Island: Luxury Condo Prices Up YoY to Most Expensive in Miami – Lead Price Growth in Overall Miami ### Annual Price/Square Foot up to $1,481, Median Sales Price also up Consistent with the overall Miami market trend of higher year-over-year prices, luxury condos in Fisher Island also reported an increase (Fig. 26.1): * Price per Square Foot increased 40.6%, up from $1,054 in 2020 to $1,481 in 2021 – also reporting the highest percentage increase in year-over-year value of all the Miami neighborhoods under review. * Median Sales Price also increased 30%, up from $4,550,000 in 2020 to $5,915,000 in 2021. ### Q4 2021 Price/Square Foot up 30.9% to $1,477, Median Sales Price down year-over-year Deviating from the overall Miami market trend of higher year-over-year prices, Fisher Island reported an increase in Price per Square Foot but decline in Median Prices (Fig. 26): * Price per Square Foot increased 30.9%, up from $1,128 in Q4 2020 to $1,477 in Q4 2021 – again closing as the most expensive neighborhood in Miami. * Median Sales Price decreased by -9.4%, down from $5,075,000 in Q4 2020 to $4,600,000 in Q4 2021. This variance in Price per Square Foot and Sales Price trends could be due to sales of smaller, amenity-rich condos dominated trends that tend to command a higher price per square foot. **Fisher Island Quarterly Price per Sq. Ft. 2017-2021 - Fig. 28** ## Fisher Island: Days on Market Up Annually & YoY ### Days on Market up 12% on annual basis and up 46% 4Q21-over-4Q20 Contrary to the overall Miami market trend of declining days on market, luxury condos perhaps reported delays in getting sold in Fisher Island: * **2021 vs 2020.** Days on Market increased 12%, indicating luxury condos spent 13 extra days on market compared to 2020\. (Fig. 26.1) * **Q4 2021 vs Q4 2020.** Days on Market increased 46% year-over-year, as luxury condos reportedly spent 43 extra on the market compared to Q4 2020. **Fisher Island Quarterly Days on Market 2018-2021 – Fig. 29** ## Fisher Island: Luxury Condo Inventory at Second-Lowest in Miami ### Q4 2021 closes with 6 months of Inventory. Consistent with the overall Miami market trend, luxury condo inventory in Fisher Island declined year-over-year but increased marginally quarter-over-year. At 6 months, inventory fell below the 9-12-month benchmark of a balanced market, giving sellers a stronghold over negotiations and the market. On an annual basis, inventory dropped by more than half from 15 months in December 2020 to 6 months in December 2021\. Compared to the pre-pandemic market, inventory was down 79.3% from 29 months in December 2019 (Fig. 30). On a quarter-over-quarter basis, inventory was slightly up from 5 months in September 2021. With inventory tight and a seller-friendly cycle in full swing, buyers are advised to put in competitive offers (preferably above asking price) as soon as possible, if they would like to own a condo of their choice on this exclusive island. Looking to sell your luxury home in Fisher Island? Call, chat, or email for a FREE market evaluation of your property to make the most of this seller's market. **Fisher Island Months of Inventory from Mar. 2019 to Dec. 2021 - Fig. 30** A balanced market has 9-12 months of inventory. The months of inventory are calculated as – no. of active listings + no. of pending listings divided by the average number of deals in the last 6 months. ## Q4 2021 Miami Beach Luxury Condo Market Conclusion Closing a phenomenal year on an equally phenomenal note, sales were up across the board in Miami Beach and its sub-markets – contributing to the soaring sales trends seen in the overall Miami luxury condo market report for year-end 2021. South Beach remained the neighborhood of choice for buyers in Miami Beach – posting record-high sales growth in a 4Q21-over-4Q20 and 2021-over-2020 analysis. Even with Miami Beach and its sub-markets reporting exceptional sales volume throughout 2021, the 12-month sales trendline closed Q4 2021 with a negative curve across the board owing to a slower Q3\. Sunny Isles Beach was the only neighborhood to report a positive trendline at year-end. Echoing the overall market trend for Q4 2021, the Price per Square Foot posted year-over-year gains across the board in Miami Beach and its sub-neighborhoods. Of these coastal districts, Fisher Island remained the most expensive zip code in Miami and Miami Beach – posting the highest Price per Square Foot of $1,477 and highest Median Sales Price of $4.6 million. While Surfside & Bal Harbour reported the highest percentage growth (88%) in year-over-year price per sq. ft. in Q4 2021, Fisher Island led annual price growth with a year-over-year increase of 41% - offering a great return on investment to sellers in both neighborhoods. Owing to domestic and international buyers putting in highly competitive offers, the Days on Market declined in most parts of Miami Beach like the overall market trend – with only Fisher Island and Surfside & Bal Harbour reporting an increase. As expected, inventory was down across the board in Miami Beach. Fisher Island closed 2021 with the lowest levels (6) of inventory out of all Miami Beach sub-neighborhoods under review. With a seller's market finding its footing in 2021, we expect the following to further influence market trends in this coastal district: * More businesses and buyers will continue migrating to South Florida for our pro-business and no-income-tax policies. * Wider acceptability of remote work and hybrid work arrangements will continue attracting individuals to the beaches. * Relaxed travel policies will draw out more foreign buyers interested in parking their investments in a safe haven like the U.S. * Fewer new construction deliveries in the immediate future will keep inventory levels low. * Rising interest rates may cause a slight slowdown, but nothing we expect to change the strong momentum of the market we are seeing here. **Metrics** **Overall Miami** **Miami Beach** **South Beach** **Mid-North Beach** **Surfside & Bal Harbour** **Sunny Isles Beach** **Fisher Island** **Sales** Up Up Up Up Up Up Up **Trendline** Flat-Positive Negative Negative Negative Negative Positive Negative **Price per Sq. Ft** Up Up Up Up Up Up Up **Days on Market** Down Down Down Flat Up Down Up **Inventory** Down Down Down Down Down Down Down Love what you see? Don't forget to share our blog and subscribe (see the subscribe link on the top menu) to receive the latest market news in your inbox. And also follow us on social media @condoblackbook. Thanks so much! **LET'S GET SOCIAL!** Connect with us on Instagram and Youtube. Questions or comments with the stats? Interested in buying a Miami Beach condo in one of these neighborhoods? Please contact Sep at sniakan (at) hbroswell.com or call 305-725-0566.
Real Estate News
Market Insights
Market Reports
Miami Beach
Mid Beach
South Beach
Sunny Isles Beach
Bal Harbour
Surfside
North Beach
Miami Beach Luxury Condo Market Report Q2 2021
View the most up-to-date market reports. Take me there now! Riding the wave of record-highs and record-lows, the luxury condo market in Miami Beach carries forward its phenomenal performance from Q4 2020 and Q1 2021 into Q2 2021\. Posting triple-digit growth, all Miami Beach neighborhoods reported record-high sales, with **Mid-North Beach emerging as the best-performing neighborhood**. In terms of prices and inventory, Fisher Island emerges as a clear favorite as always – posting the most **expensive price per square foot and record-low inventory**. Sunny Isles Beach emerges as the neighborhood with the **highest percentage growth in year-over-year price per square foot**, offering maximum returns for sellers in Miami Beach. South Beach, Mid-North Beach, and Surfside and Bal Harbour – all tied for second place with the **lowest months of inventory** in all of Miami. Miami Beach, just like the overall Miami Luxury Condo Market for Q2 2021, has officially stepped into a seller's market. After years of being a buyer-friendly market, the tables have turned with sellers gaining control of negotiations (evidenced in the steadily rising prices). Read on for more trends in our exclusive and detailed analysis on how each Miami Beach neighborhood fared against each other, as well as against the overall Miami luxury condo trends in Q2 2021. _For the purposes of this report, we've included in "Miami Beach" the sub-neighborhoods of South Beach, Mid-Beach, North-Beach, Sunny Isles Beach, Surfside, Bal Harbour, and Fisher Island as part of our Miami Beach grouping. Also, this luxury condo submarket report only features properties priced at $1 million and above._ **Miami Beach Overall Luxury Condo Market Highlights - Q2 2021:** * **Record-breaking Sales increase 620.3%** year-over-year -- Mid-North Beach is the highest percentage contributor * 12-month Sales Trendline stays positive for 3 consecutive quarters -- Q4 2020 through to Q2 2021 * Price per Square Foot up 10.7% year-over-year to $1,036 -- at record-high in more than 5 years * Median Sales Price up 26.5% year-over-year * Days on Market stay flat year-over-year * Inventory down 85.5% year-over-year to record-low of 8 months **Miami Beach Sub-neighborhood Highlights - Q2 2021:** * _**Winner:**_ Mid-North Beach leads Q2 sales growth in Miami Beach with highest percentage (956%) year-over-year increase -- 3rd-highest sales growth of all Miami neighborhoods * All Miami Beach neighborhoods post the highest-ever quarterly sales in over 6 years * 12-Month Sales Trendline keeps positive across the board for 3 consecutive quarters -- from Q4 2020 through to Q2 2021 * _**Winner:**_ Sunny Isles Beach luxury condos offered maximum value to sellers in Miami Beach with highest percentage growth (38.5%) in year-over-year Price per Sq. Ft., closely followed by Surfside and Bal Harbour (37.6%) * Fisher Island reports highest Median Sales Price of $6.1 million in all of Miami * Fisher Island continues to be the most expensive neighborhood in all of Miami, priced at $1,644/sq. ft. -- maintains top-spot for 3 consecutive quarters * Mid-North Beach reports highest percentage decline in year-over-year Days on Market (-15%), while Fisher Island reports highest percentage increase (27%) in Miami Beach * Fisher Island reports lowest inventory (5 months) in Miami, closely followed by South Beach, Mid-North Beach, plus Surfside and Bal Harbour (7 months each) * Miami Beach's luxury condo market is now a seller's market **Miami Beach Overall Luxury Condo Markets at a Glance - Q2 2021 YoY (Median Sale Price)** **Miami Beach Luxury Condo Markets at a Glance - Q2 2021 YoY (Median Sales Price / SqFt)** **Miami Beach Luxury Condo Markets at a Glance - Q2 2021 YoY (Number of sales)** ## Table of Contents 1. Overall Q2 2021 Miami Beach Luxury Condo Market Trends 2. Q2 2021 South Beach Luxury Condo Market Trends 3. Q2 2021 Mid and North Beach Luxury Condo Market Trends 4. Q2 2021 Surfside & Bal Harbour Luxury Condo Market Trends 5. Q2 2021 Sunny Isles Beach Luxury Condo Market Trends 6. Q2 2021 Fisher Island Luxury Condo Market Trends 7. Conclusion - Q2 2021 Miami Beach Luxury Condo Market Report **Q2 2021 Miami Beach Luxury Condo Market Summary - Fig. 1** **Quarters** **Number of Sales** **% change in Sales** **Median Sale Price** **% change in Median Sale Price** **Median Sp/Sqft** **% change in Median Sp/Sqft** **Median of DOM** **Q2-2021** 533 620.3% $2,150,000 26.5% $1,036 10.7% 97 **Q2-2020** 74 $1,700,000 $936 99 ## Miami Beach: Luxury Condo Sales Up to Record-High **620.3% growth in year-over-year sales + positive trendline.** From reporting the lowest sales in a second-quarter last year to the highest quarterly sales seen in over 6 years of our reporting, the luxury condo market in Miami Beach (collectively) has made phenomenal progress. Posting record-breaking sales for three straight quarters, half-year sales in Miami Beach have already outpaced the annual sales of 2020 (497), 2019 (507), or any other previous year under review (Fig. 2.1). Consistent with the positive sales trends seen in the overall Miami report for Q2 2021, this coastal grouping reported **620.3% growth in year-over-year sales and 265% growth over the pre-pandemic Q2 2019** – showing that sales momentum has gone through the roof and beyond what could have been predicted. South Beach, with its highest sales volume (165), and Mid-North Beach with its highest percentage increase in year-over-year sales (956%), are the biggest contributors to the soaring sales growth seen in Miami Beach. (See Markets at a Glance – Q2 2021 YoY Number of Sales chart above.) **Miami Beach Luxury Condo Quarterly Sales 2015-2021 - Fig. 2.1** A closer look at the monthly sales in Fig. 2.2 reveals that volumes peaked during the month of April and gradually declined by the end of the quarter. While April closed with 198 sales, May closed a notch lower with 176 sales, and June closed the quarter with 159 sales. Just like we saw and mentioned in the overall Miami report, this gradual decline in monthly sales volume could be hinting that the market may have reached its apex. Considering that the second quarter of the year is generally the strongest, we, as real estate experts, expect the market to cool down for a few cycles. However, given the intense momentum seen over the last three quarters, we still expect Miami's luxury condo market to close the year on a very strong note. **Miami Beach Luxury Condo Monthly Sales from Jan. 2016 to Jun. 2021 - Fig. 2.2** **Miami Beach Luxury Condo 12-Month Sales with Trendline - Fig. 2.3** With sales booming to new levels over the last three quarters, the 12-month Sales Trendline (Fig. 2.3) stayed positive from Q4 2020 through to Q2 2021. ## Miami Beach: Median Price per Square Foot Up to Highest in 5 Years **Price per Square Foot up 10.7% to a new high of $1036\. Median Sales Price up 26.5% year-over-year.** Consistent with the overall Miami market trend of higher year-over-year prices, Miami Beach also reported an increase in both its median price per square foot and sales price in response to this extended surge in demand. The Price per Sq. Ft. increased 10.7% year-over-year, up from $936 in Q2 last year to $1,036 for the same quarter 2021\. Remarkably for sellers, a closer look at the five-year snapshot of quarterly prices per square foot below (Fig. 3) reveals that **prices are at an all-time high** in this coastal neighborhood -- showing that sellers in Miami Beach received top value for their luxury condos. The Median Sales Price also **increased 26.5% year-over-year**, up from $1,700,000 in Q2 2020 to $2,150,000 for the same quarter this year (Fig. 1). **Miami Beach Quarterly Sales Price per Sq. Ft. 2016-2021 - Fig. 3** ## Miami Beach: Days on Market Flat YoY **Days on Market stays flat year-over-year** **.** Partly in line with the overall Miami market trend of lower days on market, luxury condos in Miami Beach spent fewer days on the market quarter-over-quarter, but almost the same number of days year-over-year. Luxury condos in this coastal district spent 23 fewer days compared to Q1 this year and just 2 fewer days on market compared to Q2 last year (Fig. 4). The above reduction reflects the actual market pace, as opposed to the past two quarters, where the statistic did not drop despite booming sales. The previous two quarters reported higher days on market due to sellers re-activating paused listings, adding to their property's total days spent on the market. However, in Q2 2021, the metric has normalized (reduced) as most of these older listings sold off -- capturing the actual pace of closings. **Miami Beach Quarterly Days on Market 2018-2021 – Fig. 4** ## Miami Beach: Inventory Down YoY to Record-Low – Enters a Seller's Market **Q2 2021 closes with 8 months of inventory.** Just like the overall Miami trend, luxury condo inventory nearly disappeared quarter-over-quarter as well as year-over-year in Miami Beach. At 8 months, inventory is down 85.5% from its peak in June 2020 of 55 months. On a quarter-over-quarter basis, inventory is down to half from 16 months in March (Fig. 5). Reporting a huge market correction, inventory is down to its lowest levels in our 6 years of reporting and now within the ideal 9-12-month range of a balanced market. This puts sellers in control of decision-making and negotiations, marking the end of the long-standing buyer-friendly market we've been reporting over the past 5-6 years. With demand outpacing supply, sellers in Miami Beach are enjoying multiple, highly competitive offers on their luxury condos. **Miami Beach Months of Inventory from Mar. 2019 to Jun. 2021 - Fig. 5** _A balanced market has only 9-12 months of inventory. The months of inventory are calculated as – number of active listings + number of pending listings, divided by the average number of deals in the last 6 months._ Looking for a market valuation on your Miami Beach condo? Call, chat, or email us for a FREE market evaluation of your property to make the most of this lucrative seller's market. ## Miami Beach Neighborhoods: Q2 2021 South Beach (ZIP 33139) **Q2 2021 South Beach Luxury Condo Market Summary - Fig. 6** **Quarters** **Number of Sales** **% change in Sales** **Median Sale Price** **% change in Median Sale Price** **Median Sp/Sqft** **% change in Median Sp/Sqft** **Median of DOM** **Q2-2021** 165 489.3% $2,250,000 26.6% $1,298 20.3% 81 **Q2-2020** 28 $1,777,500 $1,079 78 ## South Beach: Luxury Condo Sales Up YoY to New Record **489.3% growth in year-over-year sales + positive trendline.** Reporting the highest sales volume in all of Miami Beach for a second straight quarter, sales in South Beach posted a brand-new record. With a total of 165 closed sales this quarter, the beach destination **triples** its past high quarters by registering the **highest quarterly sales seen in over 6 years** of our reporting (and before from personal experience). Posting an impressive 489% increase in year-over-year sales, half-year numbers (278 sales) have already outpaced the annual sales of 2020 (118), 2019 (149), or any other previous years under review. This shows that the luxury condo market has not only bounced back from the pandemic-caused slowdown last year, but like the rest of Miami, is now in a new market even compared to some of the strongest cycles seen in the past 6 years (and before). Owing to this incredible pace, the 12-month Sales Trendline in Fig. 7.2 stayed positive from Q4 2020 through to Q2 2021. **South Beach Luxury Condo Quarterly Sales 2015-2021 - Fig. 7.1** **South Beach Luxury Condo 12-Month Sales with Trendline - Fig. 7.2** ## South Beach: Luxury Condo Price per Square Foot + Sales Price Up YoY **Price per Square Foot up 20.3% year-over-year to $1,298.** Median Price up 26.6% year-over-year. Consistent with the year-over-year price growth seen in the overall market, South Beach reported an increase in both its price per square foot and median sales price. The **Price per Square Foot increased 20.3%**, up from $1,079 in Q2 last year to $1,298 in Q2 2021\. The Median Sales Price also increased 26.6%, up from $1,777,500 in Q2 2020 to $2,250,000 for the same quarter this year (Fig. 6). A look at the five-year snapshot of quarterly Price per Square Foot below (Fig. 8) reveals that prices closed in the higher ranges for South Beach. It is also worth noting that South Beach posts the second-most expensive price per square foot of all Miami Beach neighborhoods under review (behind the most expensive neighborhood of Fisher Island) -- indicating great value for sellers in the area. **South Beach Luxury Condo Quarterly Price per Square Foot 2016-2021 - Fig. 8** ## South Beach: Days on Market Up YoY **4% increase in year-over-year Days on Market.** Deviating slightly from the overall Miami market trend of lower year-over-year days on market, luxury condos in South Beach spent 3 more days on the market compared to Q2 2020\. However, on a quarter-over-quarter basis, luxury condos spent 30 fewer days on market compared to Q1 2021 (Fig. 9). As mentioned above, the days on market trends have been showing higher for neighborhoods due to paused listings being reactivated by owners, instead of any actual delay in properties selling. Considering South Beach's marginally higher days on market, it seems that more paused listings made a comeback this Q2 2021, keeping the year-over-year trend higher. **South Beach Luxury Condo Quarterly Days on Market 2018-2021 - Fig. 9** ## South Beach: Inventory Down YoY to One of Lowest in Miami **Q2 2021 closes with 7 months of Inventory.** In sync with the overall Miami trend, luxury condo inventory in South Beach dropped to a new low in over 6 years. Luxury condo inventory in the neighborhood is not only one of the lowest in Miami Beach, but also all of Miami – South Beach shares the spot for "second-lowest inventory" in Miami Beach with Mid-North Beach and the collective neighborhood of Surfside and Bal Harbour. At 7 months, **inventory is down 80.5% from 36 months in June 2020**. It is also 53% lower than March's closing of 15 months (Fig. 10). With luxury condo inventory settling within the 9-12-month range of an ideal market, sellers are now in control of negotiations in South Beach and have the liberty to choose from multiple competitive offers. **South Beach Months of Inventory from Mar. 2019 to Jun. 2021 - Fig. 10** ## Miami Beach Neighborhoods: Q1 2021 Mid and North Beach (ZIP 33140 & 33141) **Q2 2021 Mid-North Beach Luxury Condo Quarterly Market Summary - Fig. 11** **Quarters** **Number of Sales** **% change in Sales** **Median Sale Price** **% change in Median Sale Price** **Median Sp/Sqft** **% change in Median Sp/Sqft** **Median of DOM** **Q2-2021** 95 955.6% $1,570,000 23.1% $965 11.9% 100 **Q2-2020** 9 $1,275,000 $863 118 ## Mid-North Beach: Luxury Condo Sales Up YoY – Lead Sales Growth in Miami Beach **955.6% growth in year-over-year sales + positive trendline.** Mid-North Beach might be known as the quieter side of Miami Beach, but it has definitely been making noise in terms of sales. In Q1 2021, the sub-market reported the second-highest percentage growth in year-over-year sales of all Miami Beach neighborhoods. Fast forward a quarter and it boasts of a 955.6% jump in year-over-year sales – leading sales growth in all of Miami Beach and posting the **3rd-highest growth percentage in overall Miami**. Setting a brand-new record in quarterly sales, half-year sales (169) in Mid-North Beach are already greater than the annual sales of 2020 (92), 2019 (105), or any other previous year under review (Fig. 12.1) -- just like the overall Miami market trend. Owing to this consistent increase in momentum for 3 straight quarters, Mid-North Beach reports a positive 12-month Sales Trendline from Q4 2020 through to Q2 2021 (Fig. 12.2). **Mid-Beach and North-Beach Quarterly Sales 2015-2021 - Fig. 12.1** **Mid-Beach and North-Beach 12-Month Sales with Trendline - Fig. 12.2** ## Mid-North Beach: Luxury Condo Prices Up YoY - Both Price per Square Foot + Sales Price **Price per Square Foot up 11.9% to $965\. Median Sales Price up 23.1% year-over-year.** Consistent with the overall market trend in Miami, this collective neighborhood reported an increase in both its median price per square foot and sales price in response to the surge in demand. In Q2 2021, the Price per Square Foot increased 11.9%, up from $863 in Q2 2020 to $965 this year. The Median Sales Price also increased by 23.1%, up from $1,275,000 in Q2 last year to $1,570,000 this year (Fig. 11). A look at the five-year snapshot of quarterly Price per Square Foot below (Fig. 13) reveals that prices closed in the mid-ranges for Mid-North Beach -- hinting at further room for growth for luxury condo sellers. **Mid-Beach and North-Beach Quarterly Price per Sq. Ft. 2016-2021 - Fig. 13** ## Mid-North Beach: Days on Market Down YoY **15.3% decrease in year-over-year Days on Market** **.** Slightly deviating from the overall Miami market trend of lower year-over-year days on market, Mid-North Beach reports a decline in year-over-year numbers but an increase in quarter-over-quarter days on market. Luxury condos in Mid-North Beach spent 18 fewer days on the market compared to Q2 2020\. However, on a quarter-to-quarter basis, luxury condos spent 7 more days on market (Fig. 14). As mentioned earlier in this report, the market has been seeing an increase in days on market as older (paused) listings have been making a comeback. With owners becoming more aware of the shift in market conditions (transitioning from buyer-friendly to seller-friendly), it seems more sellers found the confidence to re-list this past quarter - increasing the quarter-over-quarter days spent on market. Nonetheless, Mid-North Beach still **reported the** **highest percentage decline in year-over-year Days on Market** – making it one of the faster-selling sub-markets in Miami Beach. **Mid-Beach and North-Beach Luxury Condo Quarterly Days on Market 2018-2021 – Fig. 14** ## Mid-North Beach: Inventory Down YoY to One of Lowest in Miami **Q2 2021 closes with 7 months of Inventory.** Consistent with the overall Miami market trend, luxury condo inventory in Mid-North Beach is at its lowest in more than 6 years. Sharing the second spot for lowest inventory in Miami Beach and overall Miami, Mid-North Beach reports 7 months of inventory – same as South Beach and the collective neighborhood of Surfside and Bal Harbour. At 7 months, **inventory is down 88.3%** from its peak of 60 months in June 2020\. On a quarter-over-quarter basis, inventory is down 41.7% from 12 months in March (Fig. 15). With inventory within the 9-12-month range of a balanced market, sellers are now in control of negotiations evidenced by the increase in prices seen above (Fig. 13). **Mid-Beach and North-Beach Months of Inventory from Mar. 2019 to Jun. 2021 - Fig. 15** _A balanced market has only 9-12 months of inventory. The months of inventory are calculated as – no. of active listings + no. of pending listings divided by the average number of deals in the last 6 months._ ## Miami Beach Neighborhoods: Q2 2021 Surfside & Bal Harbour **Q2 2021 Surfside & Bal Harbour Luxury Condo Quarterly Market Summary - Fig. 16** **Quarters** **Number of Sales** **% change in Sales** **Median Sale Price** **% change in Median Sale Price** **Median Sp/Sqft** **% change in Median Sp/Sqft** **Median of DOM** **Q2-2021** 75 525.0% $2,675,000 10.5% $1,184 37.6% 117 **Q2-2020** 12 $2,420,500 $860 125 ## Surfside & Bal Harbour: Luxury Condo Sales Up YoY to New Record-high **525% growth in year-over-year sales + positive trendline.** In sync with the overall Miami market trend, this combined neighborhood reports its highest quarterly sales seen in more than 6 years -- topping out its Q1 2021 high. Setting a new record, the community-focused neighborhood posts an impressive 525% jump in year-over-year volumes. Like the rest of Miami, half-year sales (127) in Surfside & Bal Harbour are already higher than the annual sales of 2020 (83), 2019 (84), or any other previous year under review (Fig. 17.1). In a nod to the phenomenal pace seen over the past three quarters, the 12-month Sales Trendline in Fig. 17.2 stayed positive from Q4 2020 through to Q2 2021. **Surfside & Bal Harbour Quarterly Sales 2015-2021 - Fig. 17.1** **Surfside & Bal Harbour 12-Month Sales with Trendline - Fig. 17.2** ## Surfside & Bal Harbour: Higher YoY Price per Square Foot + Sales Price **Price per Square Foot up 37.6% to $1,184.** Median Sales Price up 10.5% year-over-year. Keeping with the year-over-year price growth seen in overall Miami, Surfside and Bal Harbour reports an increase in both its price per square foot and median sales price. The **Price per Square Foot increased 37.6%**, up from $860 in Q2 2020 to $1,184 for the same quarter this year. The Median Sales Price also increased 10.5%, up from $2,420,500 in Q2 2020 to $2,675,000 in Q2 this year (Fig. 16). A look at the five-year snapshot of quarterly Price per Square Foot below (Fig. 18) reveals that prices closed in the higher ranges for this grouping. It is also worth noting that Surfside and Bal Harbour posted the **second-highest percentage increase in year-over-year prices** (right behind Sunny Isles Beach) -- showing impressive value for sellers in the area. **Surfside & Bal Harbour Quarterly Price per Sq. Ft. 2016-2021 - Fig. 18** ## Surfside & Bal Harbour: Days on Market Down YoY **6.4% decrease in year-over-year Days on Market** **.** Consistent with the overall Miami market trend of lower year-over-year days on market, luxury condos in Surfside & Bal Harbour spent 8 fewer days on the market compared to Q2 last year and 2 fewer days compared to Q1 this year (Fig. 19). **Surfside & Bal Harbour Quarterly Days on Market 2018-2021 – Fig. 19** ## Surfside & Bal Harbour: Luxury Condo Inventory Down YoY to One of Lowest in Miami **Q2 2021 closes with 7 months of Inventory.** In sync with the overall Miami market trend, luxury condo inventory in Surfside & Bal Harbour has dropped to a new low. Reporting the same months of inventory as South Beach and Mid-North Beach, this combined neighborhood posts the second-lowest inventory in all of Miami. At 7 months, **inventory is down 77.4%** from 31 months in June 2020\. On a quarter-over-quarter basis, inventory is down 53.3% from 15 months in March 2021 (Fig. 20). With inventory falling within the 9-12-month range of a balanced market, sellers have regained hold on the market from buyers, after a hiatus of over 6 years. **Surfside & Bal Harbour Months of Inventory from Mar. 2019 to Jun. 2021 - Fig. 20** _A balanced market has only 9-12 months of inventory. The months of inventory are calculated as – no. of active listings + no. of pending listings divided by the average number of deals in the last 6 months._ If you are interested in buying or selling a condo in any of these Miami Beach neighborhoods, or would like more information about the data in our reports, please email us anytime or call (786) 655 - 4576. ## Miami Beach Neighborhoods: Q2 2021 Sunny Isles Beach **Q2 2021 Sunny Isles Beach Luxury Condo Quarterly Market Summary - Fig. 21** **Quarters** **Number of Sales** **% change in Sales** **Median Sale Price** **% change in Median Sale Price** **Median Sp/Sqft** **% change in Median Sp/Sqft** **Median of DOM** **Q2-2021** 161 794.4% $1,920,000 40.9% $822 38.5% 109 **Q2-2020** 18 $1,362,500 $593 108 ## Sunny Isles: Luxury Condo Sales Up YoY - 2nd-Highest Growth in Miami Beach **794.4% growth in year-over-year sales + positive trendline.** In line with the overall Miami market trend, Sunny Isles Beach reported the highest quarterly sales seen in over 6 years – setting a brand-new record. With a 794.4% jump in year-over-year volumes, half-year sales (266) in this branded-condo corridor are already greater than the annual sales of 2020 (162), 2019 (133), or any other year under review (Fig. 22.1). Considering how sales have been increasing for 4 consecutive quarters in this beach town, the 12-month Sales Trendline in Fig. 22.2 expectedly remained positive from Q4 2020 through to Q2 2021. **Sunny Isles Beach Luxury Condo Quarterly Sales 2015-2021 - Fig. 22.1** **Sunny Isles Beach Luxury Condo 12-Month Sales with Trendline - Fig. 22.2** ## Sunny Isles: Price per Square Foot Peaks with Highest Percentage Increase in Miami Beach **Price per Square Foot up 38.5% to $822.** Median Sales Price up 40.9% year-over-year. Consistent with the overall Miami market trend of higher year-over-year prices, Sunny Isles Beach reported an increase in both its price per square foot and median sales price. The **Price per Square Foot increased 38.5%**, up from $593 in Q2 last year to a new high of $822 in Q2 2021\. The Median Sales Price also increased 40.9%, up from $1,362,500 in Q2 2020 to $1,920,000 for the same quarter this year. A look at the five-year snapshot of quarterly Price per Square Foot below (Fig. 23) reveals that prices closed at their highest in over 6 years of our reporting. It is also worth noting that luxury condos in Sunny Isles Beach Surfside offered the **maximum value to sellers in Miami Beach** by posting the highest **percentage increase in year-over-year prices**. For buyers, Sunny Isles Beach is one of the lowest priced coastal neighborhoods in the beaches, offering a good entry point. **Sunny Isles Beach Quarterly Price per Sq. Ft. 2016-2021 - Fig. 23** ## Sunny Isles: Days on Market Flat YoY **Days on Market down quarter-over-quarter** **.** Slightly deviating from the overall Miami market trend of lower year-over-year days on market, luxury condos in Sunny Isles Beach spent fewer days on market compared to the previous quarter, but almost the same number of days year-over-year. Luxury condos in this seaside neighborhood spent 43 fewer days compared to Q1 this year, but just 1 more day compared to Q2 2020 (Fig. 24). This is a market positive, showing that buyers and sellers have been mostly on the same page in terms of pricing and other expectations. **Sunny Isles Beach Quarterly Days on Market 2018-2021 – Fig. 24** ## Sunny Isles: Inventory Down YoY - Continues as Highest in Miami Beach **Q2 2021 closes with 12 months of Inventory.** Consistent with the overall Miami market trend, inventory in Sunny Isles dropped to a record-low. At 12 months, inventory is down to its **lowest in over 6 years of our reporting**, dropping 86.7% from its peak of 90 months in June 2020\. It is also 37% lower than the previous quarter's closing of 19 months (Fig. 25). Although Sunny Isles posted the **highest levels of inventory in Miami Beach for Q2 2021**, it has successfully transitioned into a seller's market as levels fall within the 9-12-month range of an ideal market. **Sunny Isles Beach Months of Inventory from Mar. 2019 to Jun. 2021 - Fig. 25** _A balanced market has only 9-12 months of inventory. The months of inventory are calculated as – no. of active listings + no. of pending listings divided by the average number of deals in the last 6 months._ ## Miami Beach Neighborhoods: Q2 2021 Fisher Island **Q2 2021 Fisher Island Luxury Condo Quarterly Market Summary - Fig. 26** **Quarters** **Number of Sales** **% change in Sales** **Median Sale Price** **% change in Median Sale Price** **Median Sp/Sqft** **% change in Median Sp/Sqft** **Median of DOM** **Q2-2021** 37 428.6% $6,100,000 25.8% $1,644 25.1% 119 **Q2-2020** 7 $4,850,000 $1,314 94 ## Fisher Island: Luxury Condo Sales Up YoY to New High **428.6% growth in year-over-year sales + positive trendline.** Consistent with the overall Miami market trend, Fisher Island reports its **highest quarterly sales seen in over 6 years** of us reporting. With a 428.6% spike in year-over-year sales, half-year sales (59) in this exclusive island are already greater than the total yearly sales of 2020 (43), 2019 (36), or any other previous year under review (Fig. 27.1) – again in sync with the overall market trend. Owing to phenomenal sales momentum carried over the past four quarters, the 12-month Sales Trendline in Fig. 27.2 stayed positive from Q4 2020 through to Q2 2021. **Fisher Island Luxury Condo Quarterly Sales 2015-2021 - Fig. 27.1** **Fisher Island Luxury Condo 12-Month Sales with Trendline - Fig. 27.2** ## Fisher Island: Luxury Condo Prices Most Expensive in Miami, Up YoY **Price per Square Foot up 25.1%, still most expensive at $1,644.** Median Sales Price up 25.8% year-over-year. In line with the overall Miami market trend of higher year-over-year prices, Fisher Island reported an increase in both its price per square foot and sales price. The **Price per Square Foot increased 25.1% year-over-year**, up from $1,314 in Q2 2020 to $1,644 for the same quarter this year. The Median Sales Price also increased 25.8%, up from $4,850,000 in Q2 last year to $6,100,000 this year (Fig. 26). With these increases, this exclusive island holds on to its position as the **most expensive neighborhood in all of Miami** for a third consecutive quarter and reports the **highest Median Sales Price of $6.1 million in all of Miami**. **Fisher Island Quarterly Price per Sq. Ft. 2016-2021 - Fig. 28** ## Fisher Island: Days on Market Up YoY **26.6% increase in year-over-year Days on Market** **.** In contrast to the overall Miami market trend of lower year-over-year days on market, luxury condos on Fisher Island took 25 extra days to be sold compared to Q2 last year (Fig. 29). However, on a quarter-over-quarter basis, luxury condos spent 17 fewer extra days on market compared to Q1 2021. **Fisher Island Quarterly Days on Market 2018-2021 – Fig. 29** ## Fisher Island: Inventory Down to Lowest in Miami **Q2 2021 closes with 5 months of Inventory.** In line with the overall market trend in Miami, luxury condo inventory in Fisher Island dipped to the lowest of all Miami neighborhoods under review. At 5 months, inventory is also down to its lowest in over 6 years, dropping by 91.8% from its peak of 61 months in June 2020\. Levels are also 54.5% lower than their previous quarter closing of 11 months (Fig. 30). One of the first Miami Beach neighborhoods to enter a seller's market, inventory has been quickly absorbed by buyers over this past quarter, bringing it lower than the ideal 9-12-month range of a balanced market. This shows that sellers are in complete control of negotiations, with ample demand and higher prices working seamlessly in their favor. Looking to sell your luxury home in Fisher Island? Call, chat, or email for a FREE market evaluation of your property to make the most of this seller's market. **Fisher Island Months of Inventory from Mar. 2019 to Jun. 2021 - Fig. 30** _A balanced market has only 9-12 months of inventory. The months of inventory are calculated as – no. of active listings + no. of pending listings divided by the average number of deals in the last 6 months._ ## Q2 2021 Miami Beach Luxury Condo Market Conclusion Even though the second quarter of the year is usually the strongest, nobody could have predicted luxury condo sales to skyrocket as they have. Breaking all previous records for the highest quarterly sales, all Miami Beach neighborhoods have posted new highs in Q2 2021. All sub-markets in this report posted incredible triple-digit year-over-year growth, and Mid-North Beach turned out to be the most popular neighborhood with its highest percentage increase in sale volumes. The sub-market also ranked 3rd for leading sales growth in the Q2 2021 overall Miami market report. Owing to such phenomenal momentum, the 12-month Sales Trendline kept its positive angle across the board for a third quarter in a row – from Q4 2020 through to Q2 2021 – just like the overall market trend. Prices were higher year-over-year across the board in Miami Beach, like the overall market trend in Miami. Fisher Island ruled the rankings once again, turning out to be the most expensive neighborhood with a price of $1,644/sq. ft. It also posted the highest median sales price out of all Miami neighborhoods under review at $6.1 million. On the other hand, Sunny Isles Beach continued to offer a nice entry point into luxury condos on the beach with the lowest price per square foot of $822 in all of the Miami Beaches. In terms of value and price growth, Sunny Isles Beach led the way with the highest percentage growth (38.5%) in year-over-year Price per Sq. Ft., followed by Surfside and Bal Harbour (37.6%). Both neighborhoods offered great value to sellers. In terms of Days on Market, Miami Beach still seems to be dealing with older listings making a comeback on the market, keeping numbers inconsistently high. Deviating from the overall Miami market trend of lower year-over-year days on market, luxury condos in South Beach and Fisher Island reported higher days spent on the market, while Sunny Isles Beach reported the same days as Q2 2020. With such incredible momentum at play, inventory dropped across the board to an all-time low (in our 6 years of reporting), like the overall Miami report. Fisher Island reported the lowest levels of inventory at 5 months, while South Beach, Mid-North Beach, plus Surfside and Bal Harbour tied for the second-lowest levels with 7 months each. Reporting the strongest second-quarter in over 6 years, Miami Beach is officially a seller's market. However, as real estate experts, we expect the market to take a cyclical break over the next half of the year. Still, we know that this year will close stronger-than-ever due to the following: * more businesses and buyers leaving high-tax states for our tax-friendly environment, * those with the flexibility to work from home or a hybrid arrangement choosing to live their dream with a condo closer to the ocean and year-round warmth, * ready availability of vaccinations and relaxed travel policies bringing in foreign buyers by the droves to their safe investment haven in the U.S., and * lower luxury condo deliveries in the immediate future keeping inventory levels in check, even when sales catch a break. Metrics Overall Miami Miami Beach South Beach Mid-North Beach Surfside & Bal Harbour Sunny Isles Beach Fisher Island Sales Up Up Up Up Up Up Up Trendline Positive Positive Positive Positive Positive Positive Positive Price per Sq. Ft Up Up Up Up Up Up Up Days on Market Down Flat Up Down Down Flat Up Inventory Down Down Down Down Down Down Down Love what you see? Don't forget to share our blog and subscribe (see the subscribe link on the top menu) to receive the latest market news in your inbox. And also follow us on social media @condoblackbook. Thanks so much! --- _Questions or comments with the stats? Interested in buying a Miami Beach condo in one of these neighborhoods? Please contact Sep at sniakan (at) hbroswell.com or call 305-725-0566._ **LET'S GET SOCIAL!** Connect with us on Instagram and Youtube.