
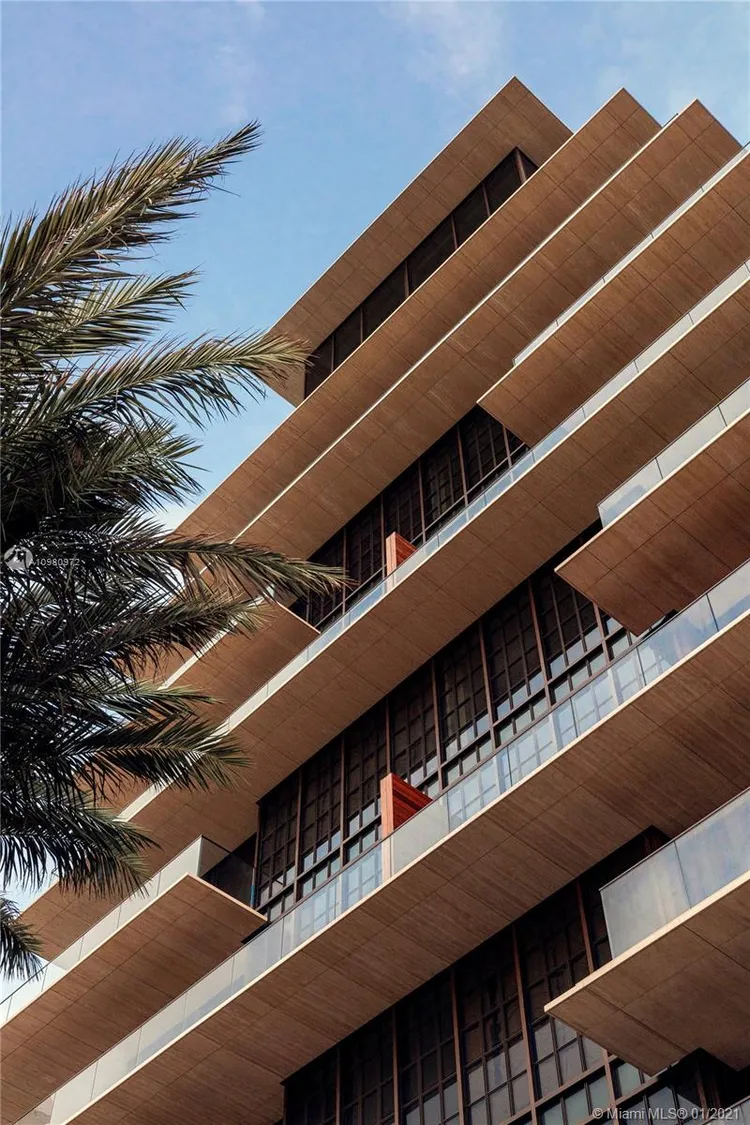
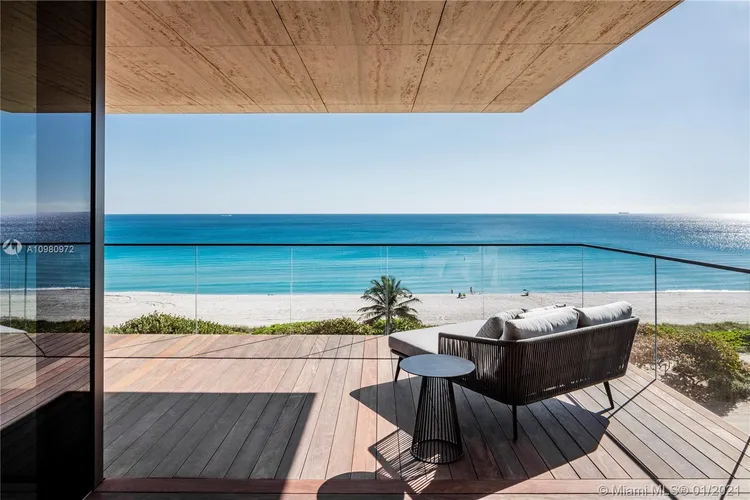
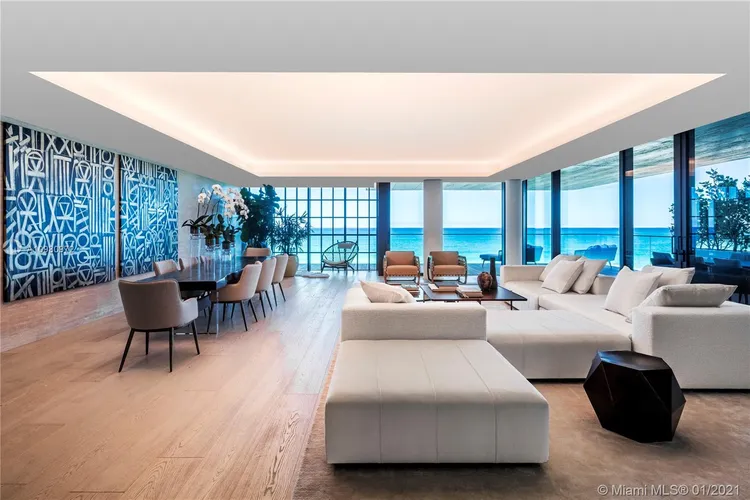
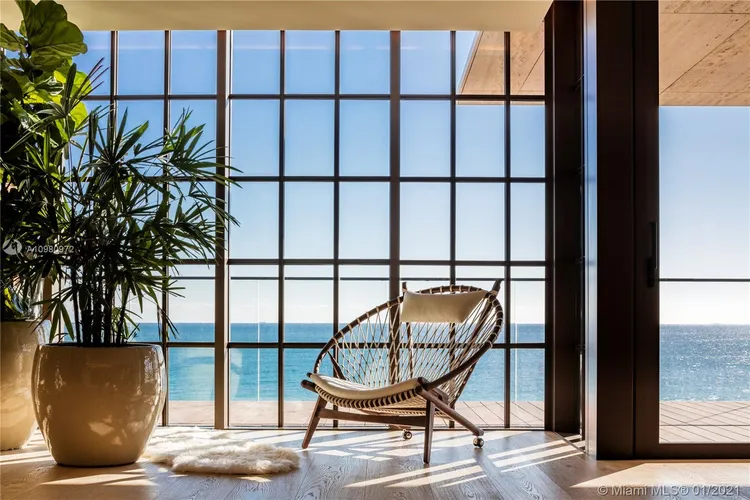
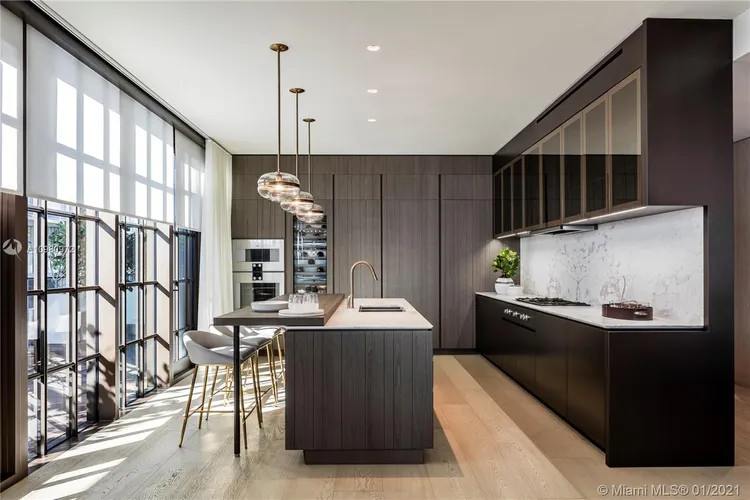
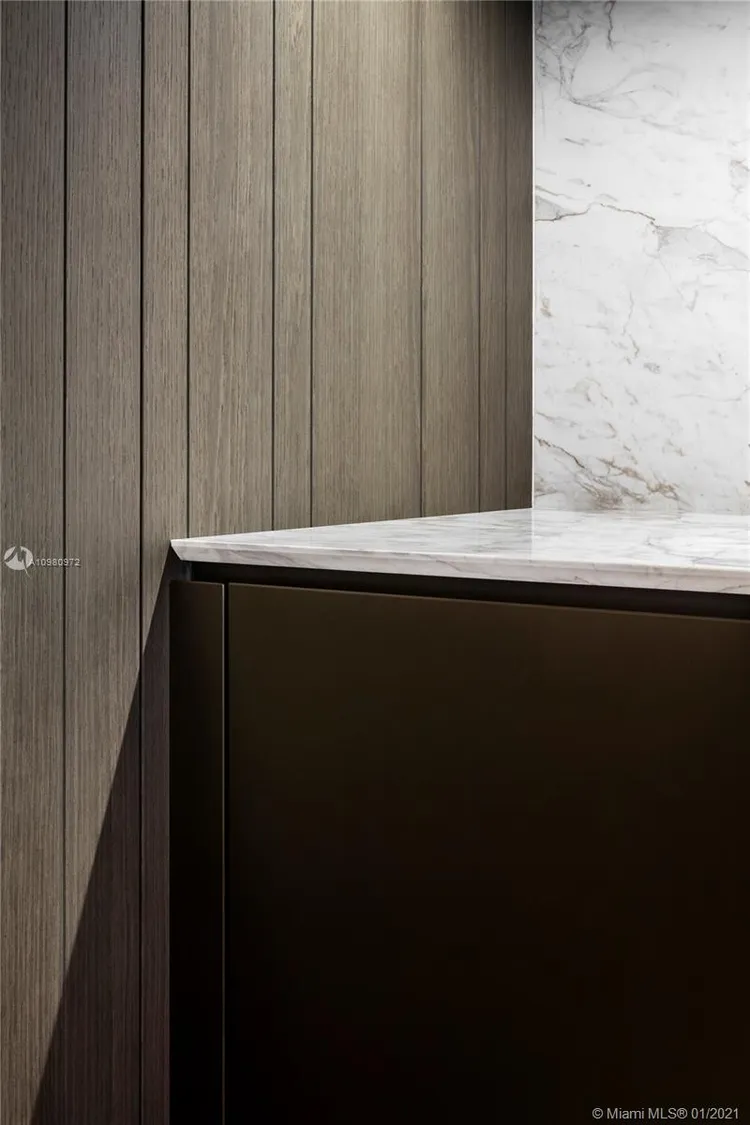
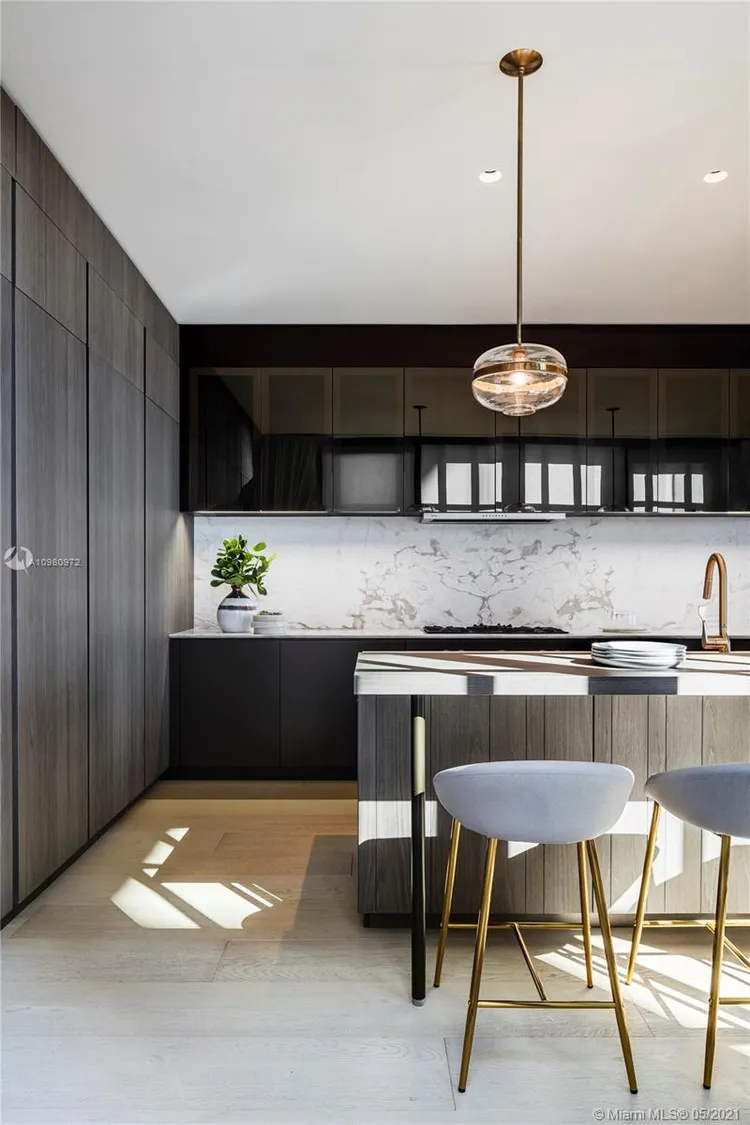
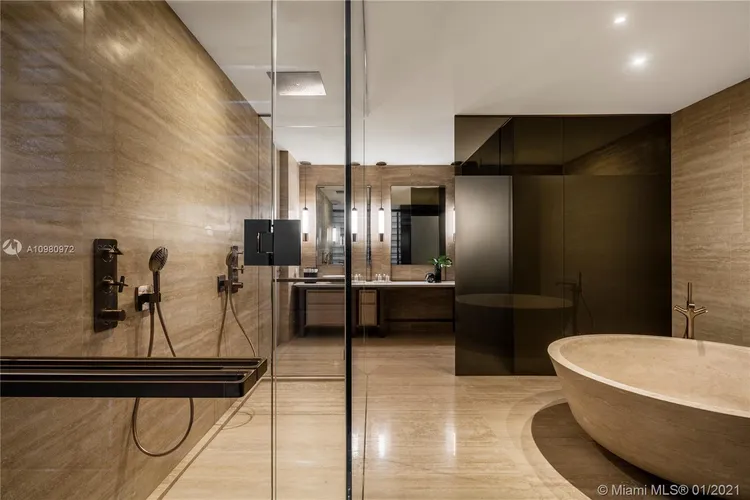
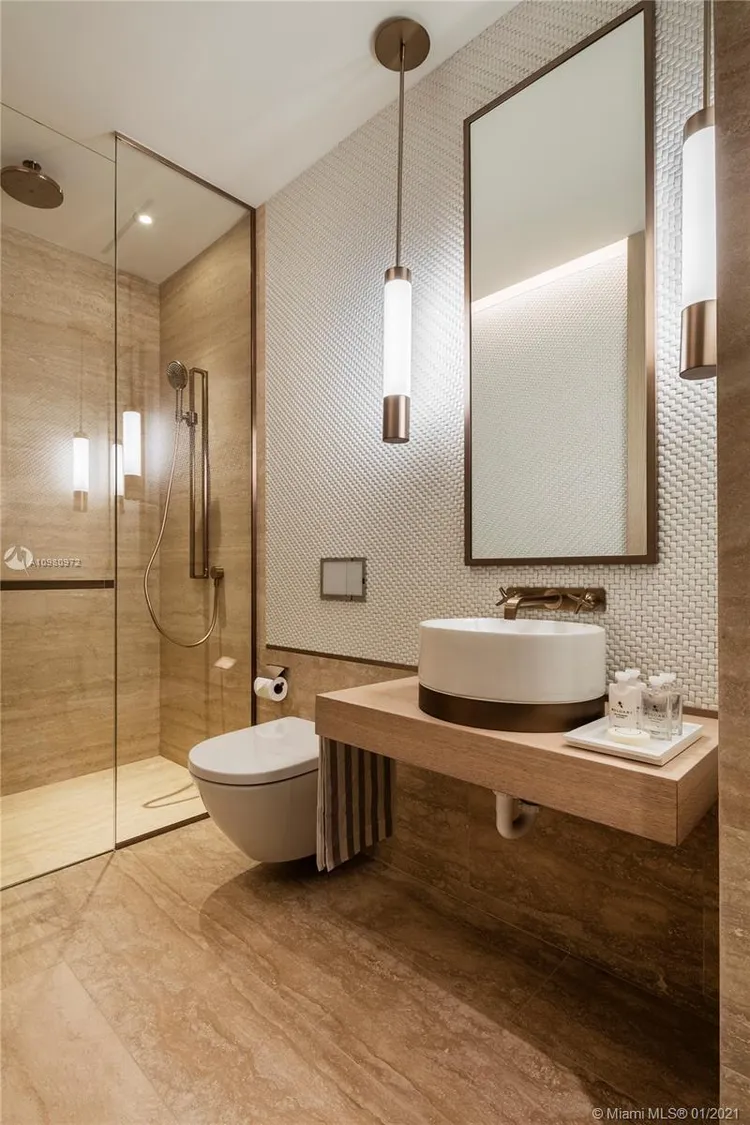
Arte by Antonio Citterio #LPH
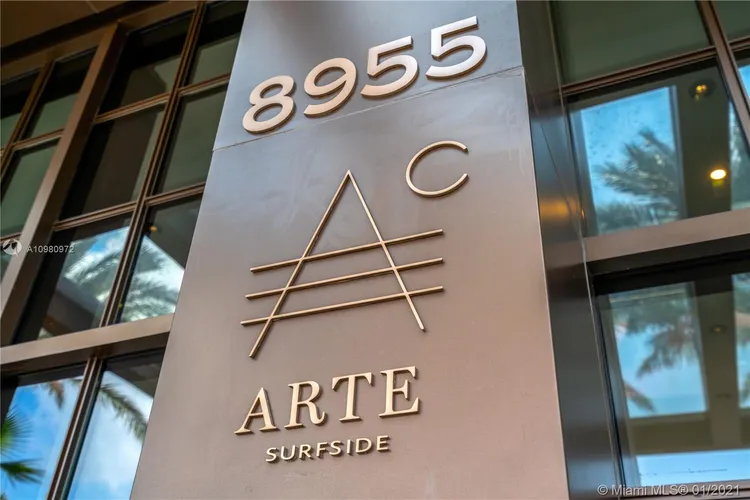
8955 Collins Avenue, Surfside Florida 33154


About
Arte by Antonio Citterio #LPH
Key features
Unit features
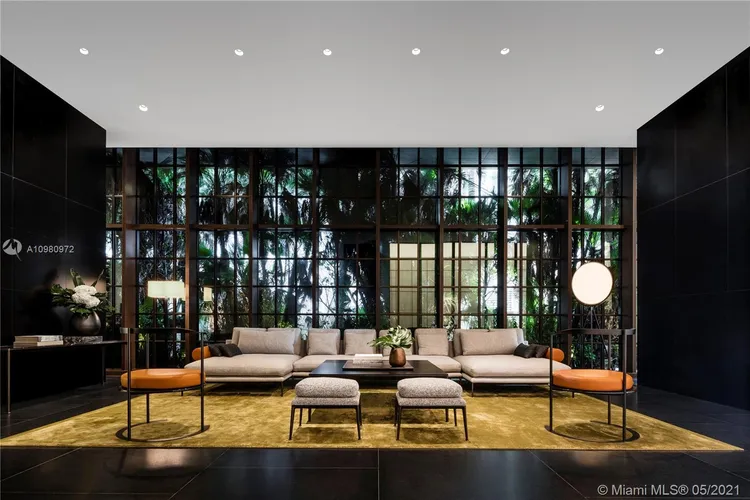
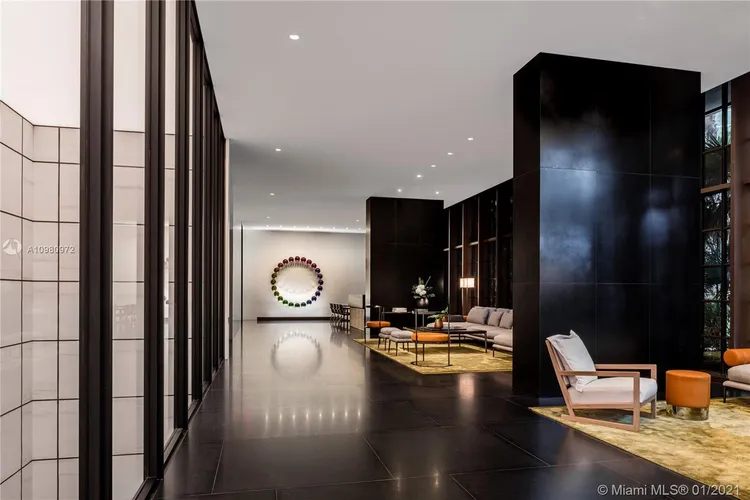
Building Amenities


Additional Unit Details
CondoBlackBook.com and Blackbook Properties are not responsible for the accuracy of the Arte by Antonio Citterio condos in Surfside information listed above. The data relating to real estate for sale on this web page comes in part from the Internet Data Exchange Program and the South East Florida Regional MLS and is provided here for consumers personal, non-commercial use, It may not be used for any purpose other than to identify prospective Miami Beach area condos consumers may be interested in purchasing. Data provided is deemed reliable but not guaranteed. Listing provided by Douglas Elliman.
The floorplan
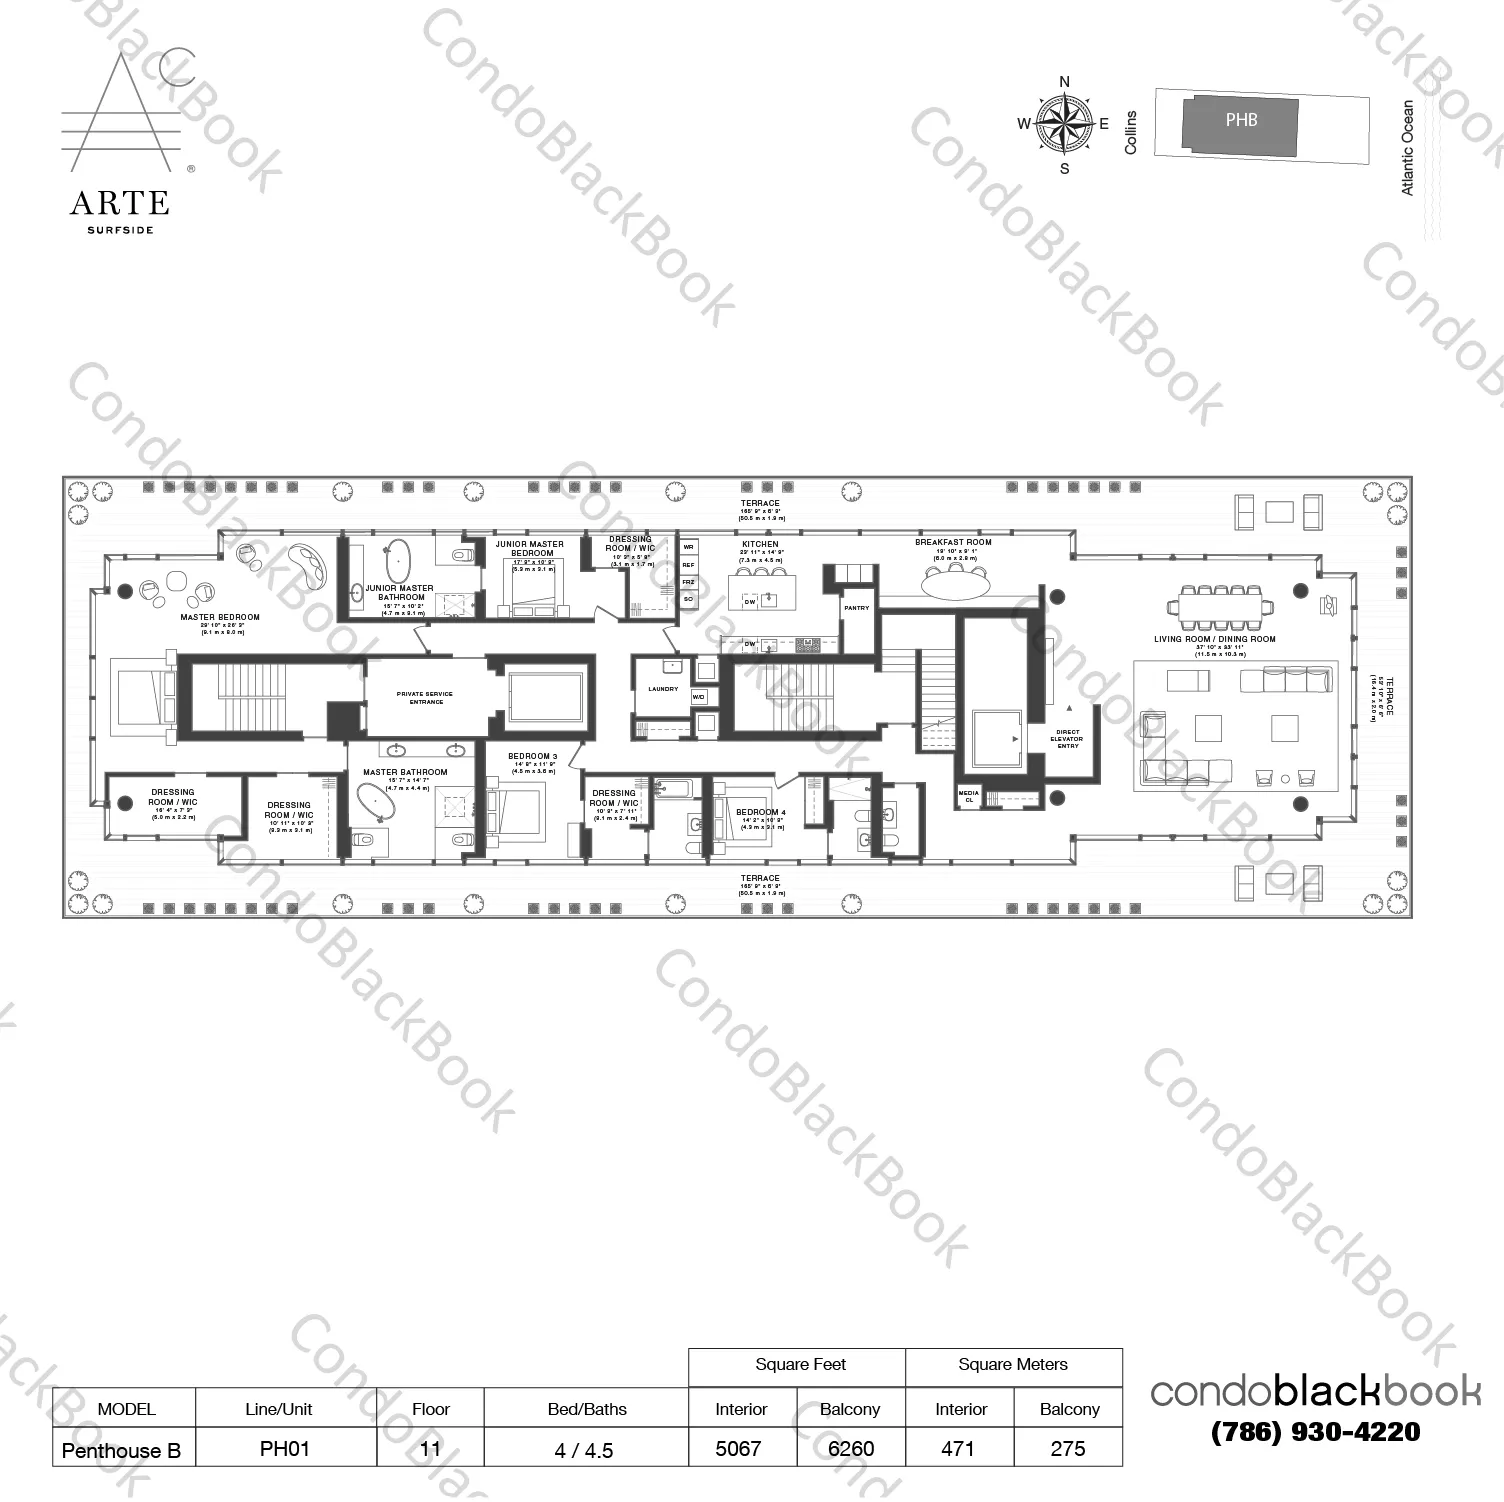
Floor plan disclaimer: condoblackbook.com uses an automated floor plan condo matching system to match condos to the original developer floor plans. This plan has not been posted by or verified with the owner or listing broker. Floor plans are for general information and convenience only and cannot be relied upon for purchase or rental without independent third party verification. Most floor plans represent the original developer plans and may have since been modified.
Request info
Price history

Price history
Condo Value Estimates
Condo Value Estimates
Real Estate News
Luxury
Surfside
The 5 Most Luxurious Condos in Surfside, Miami
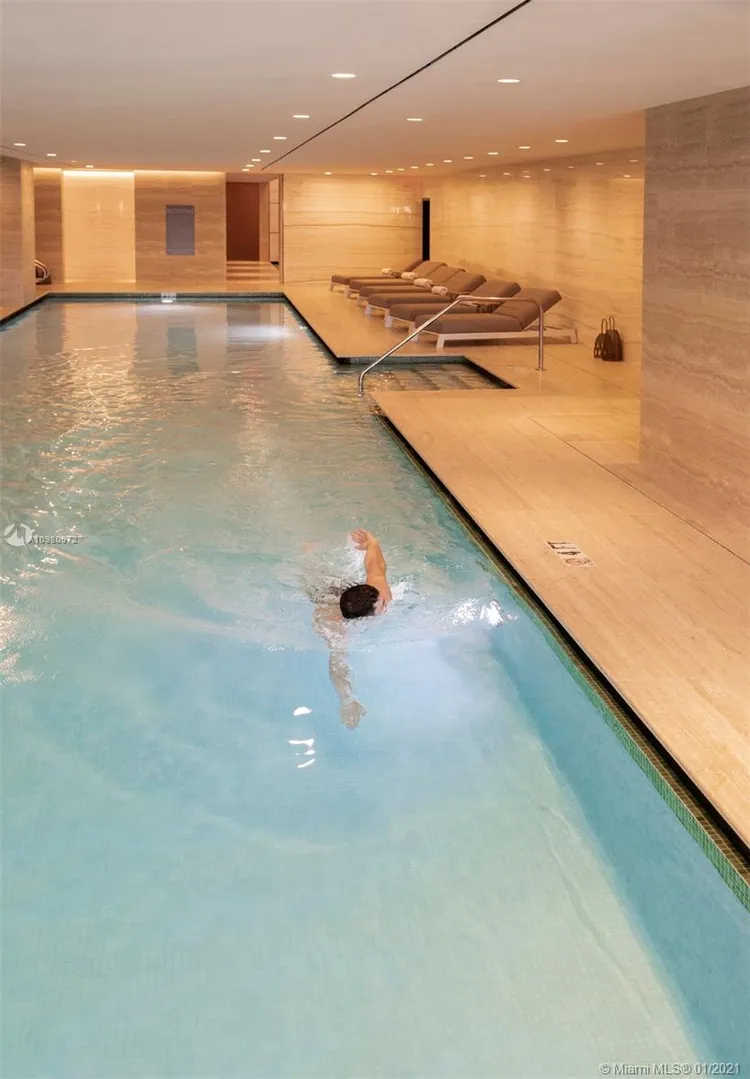
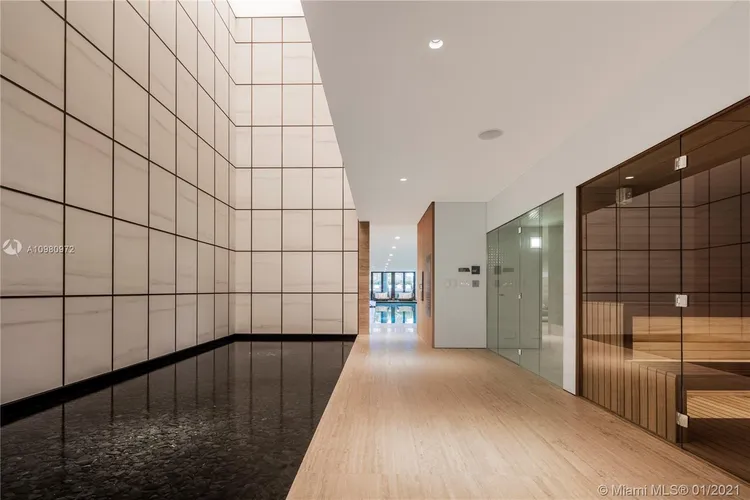
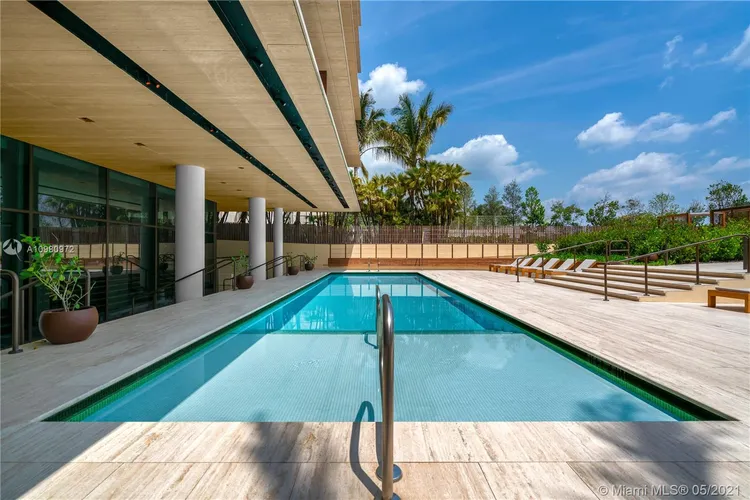
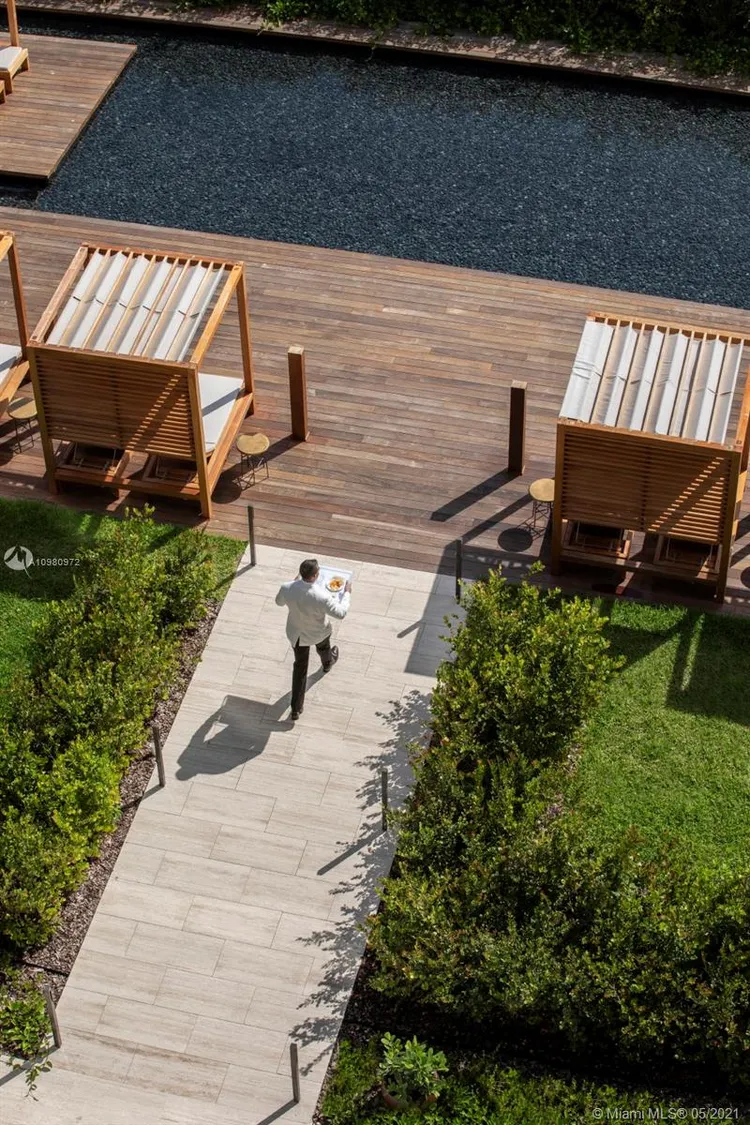
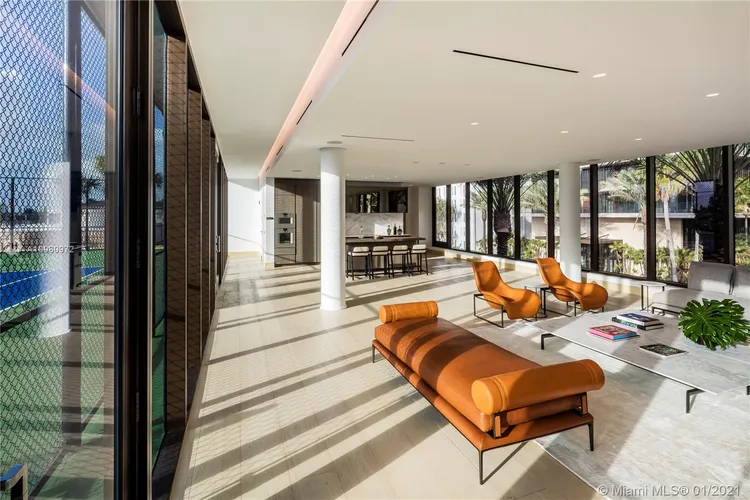
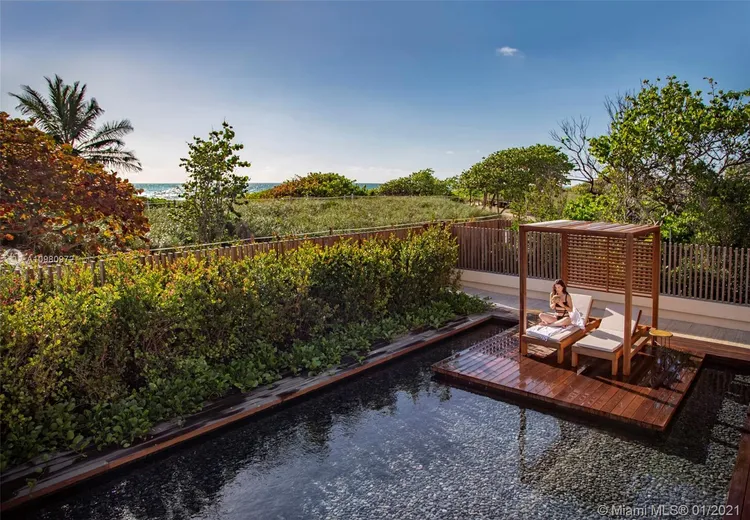
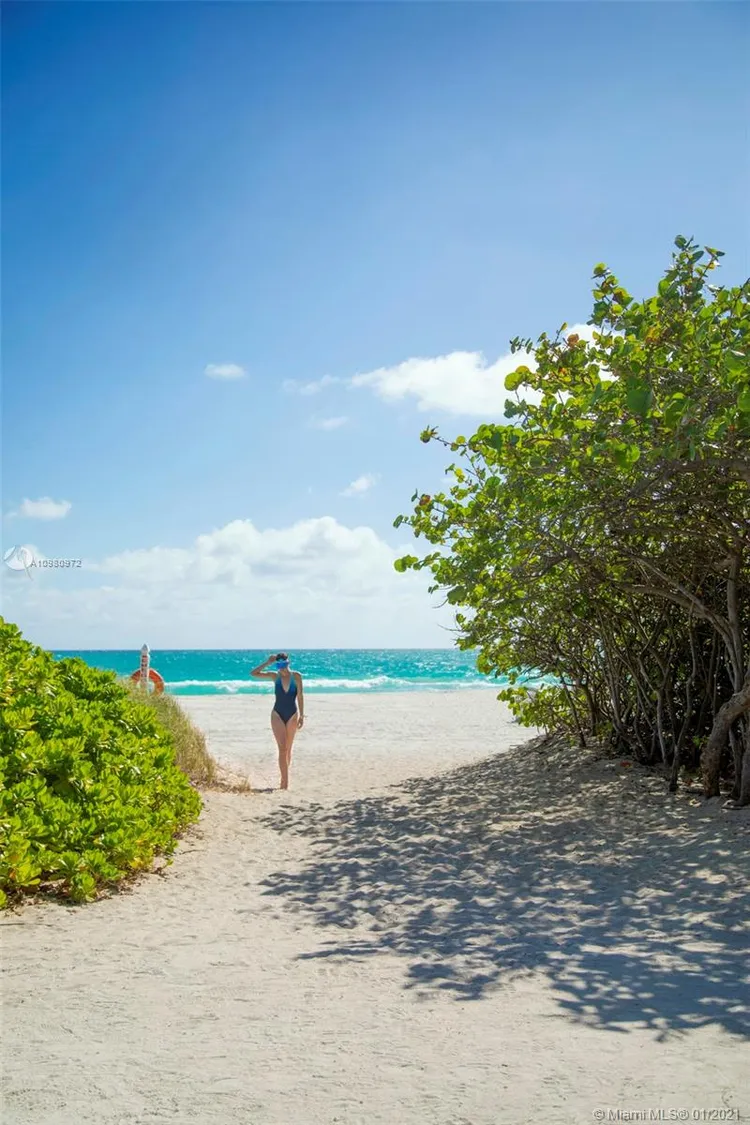
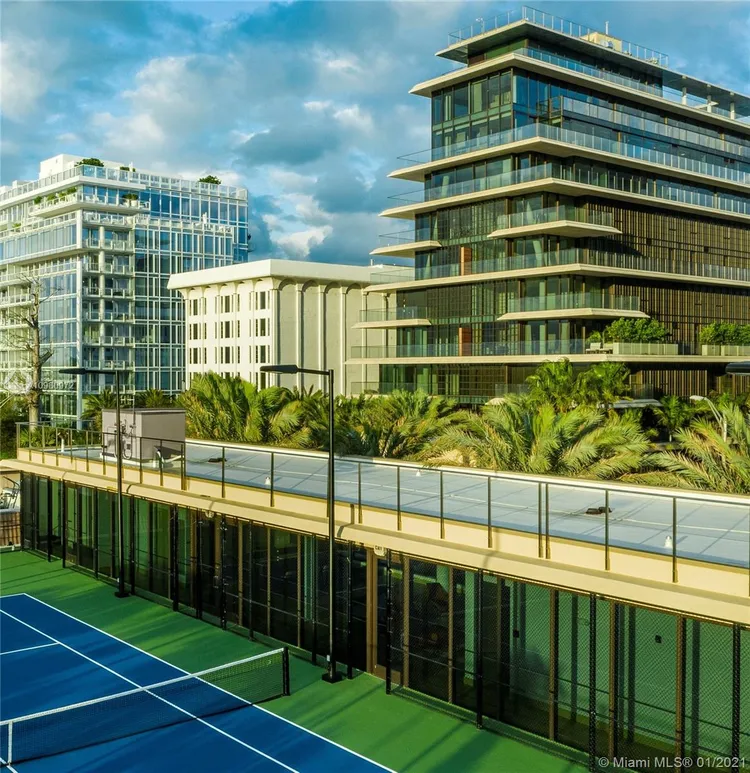
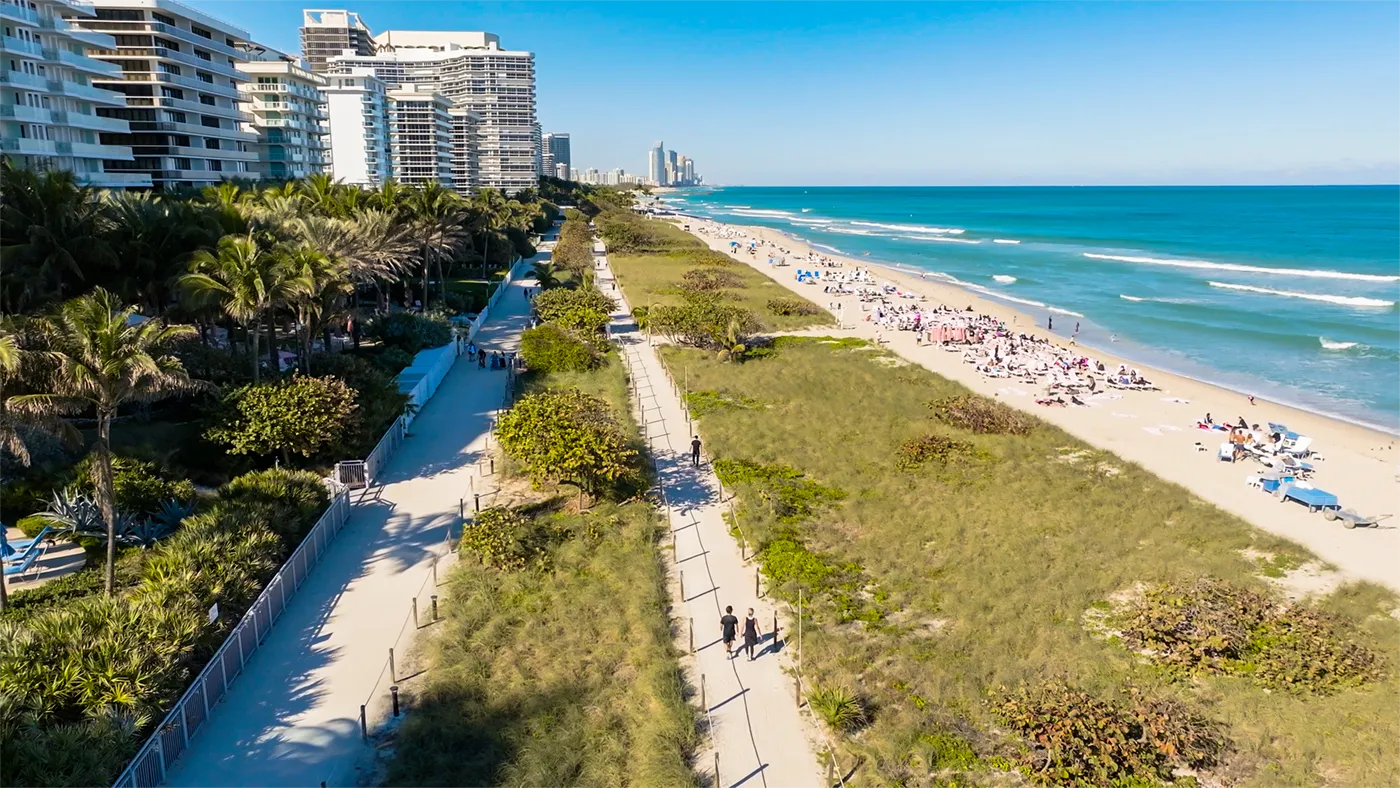
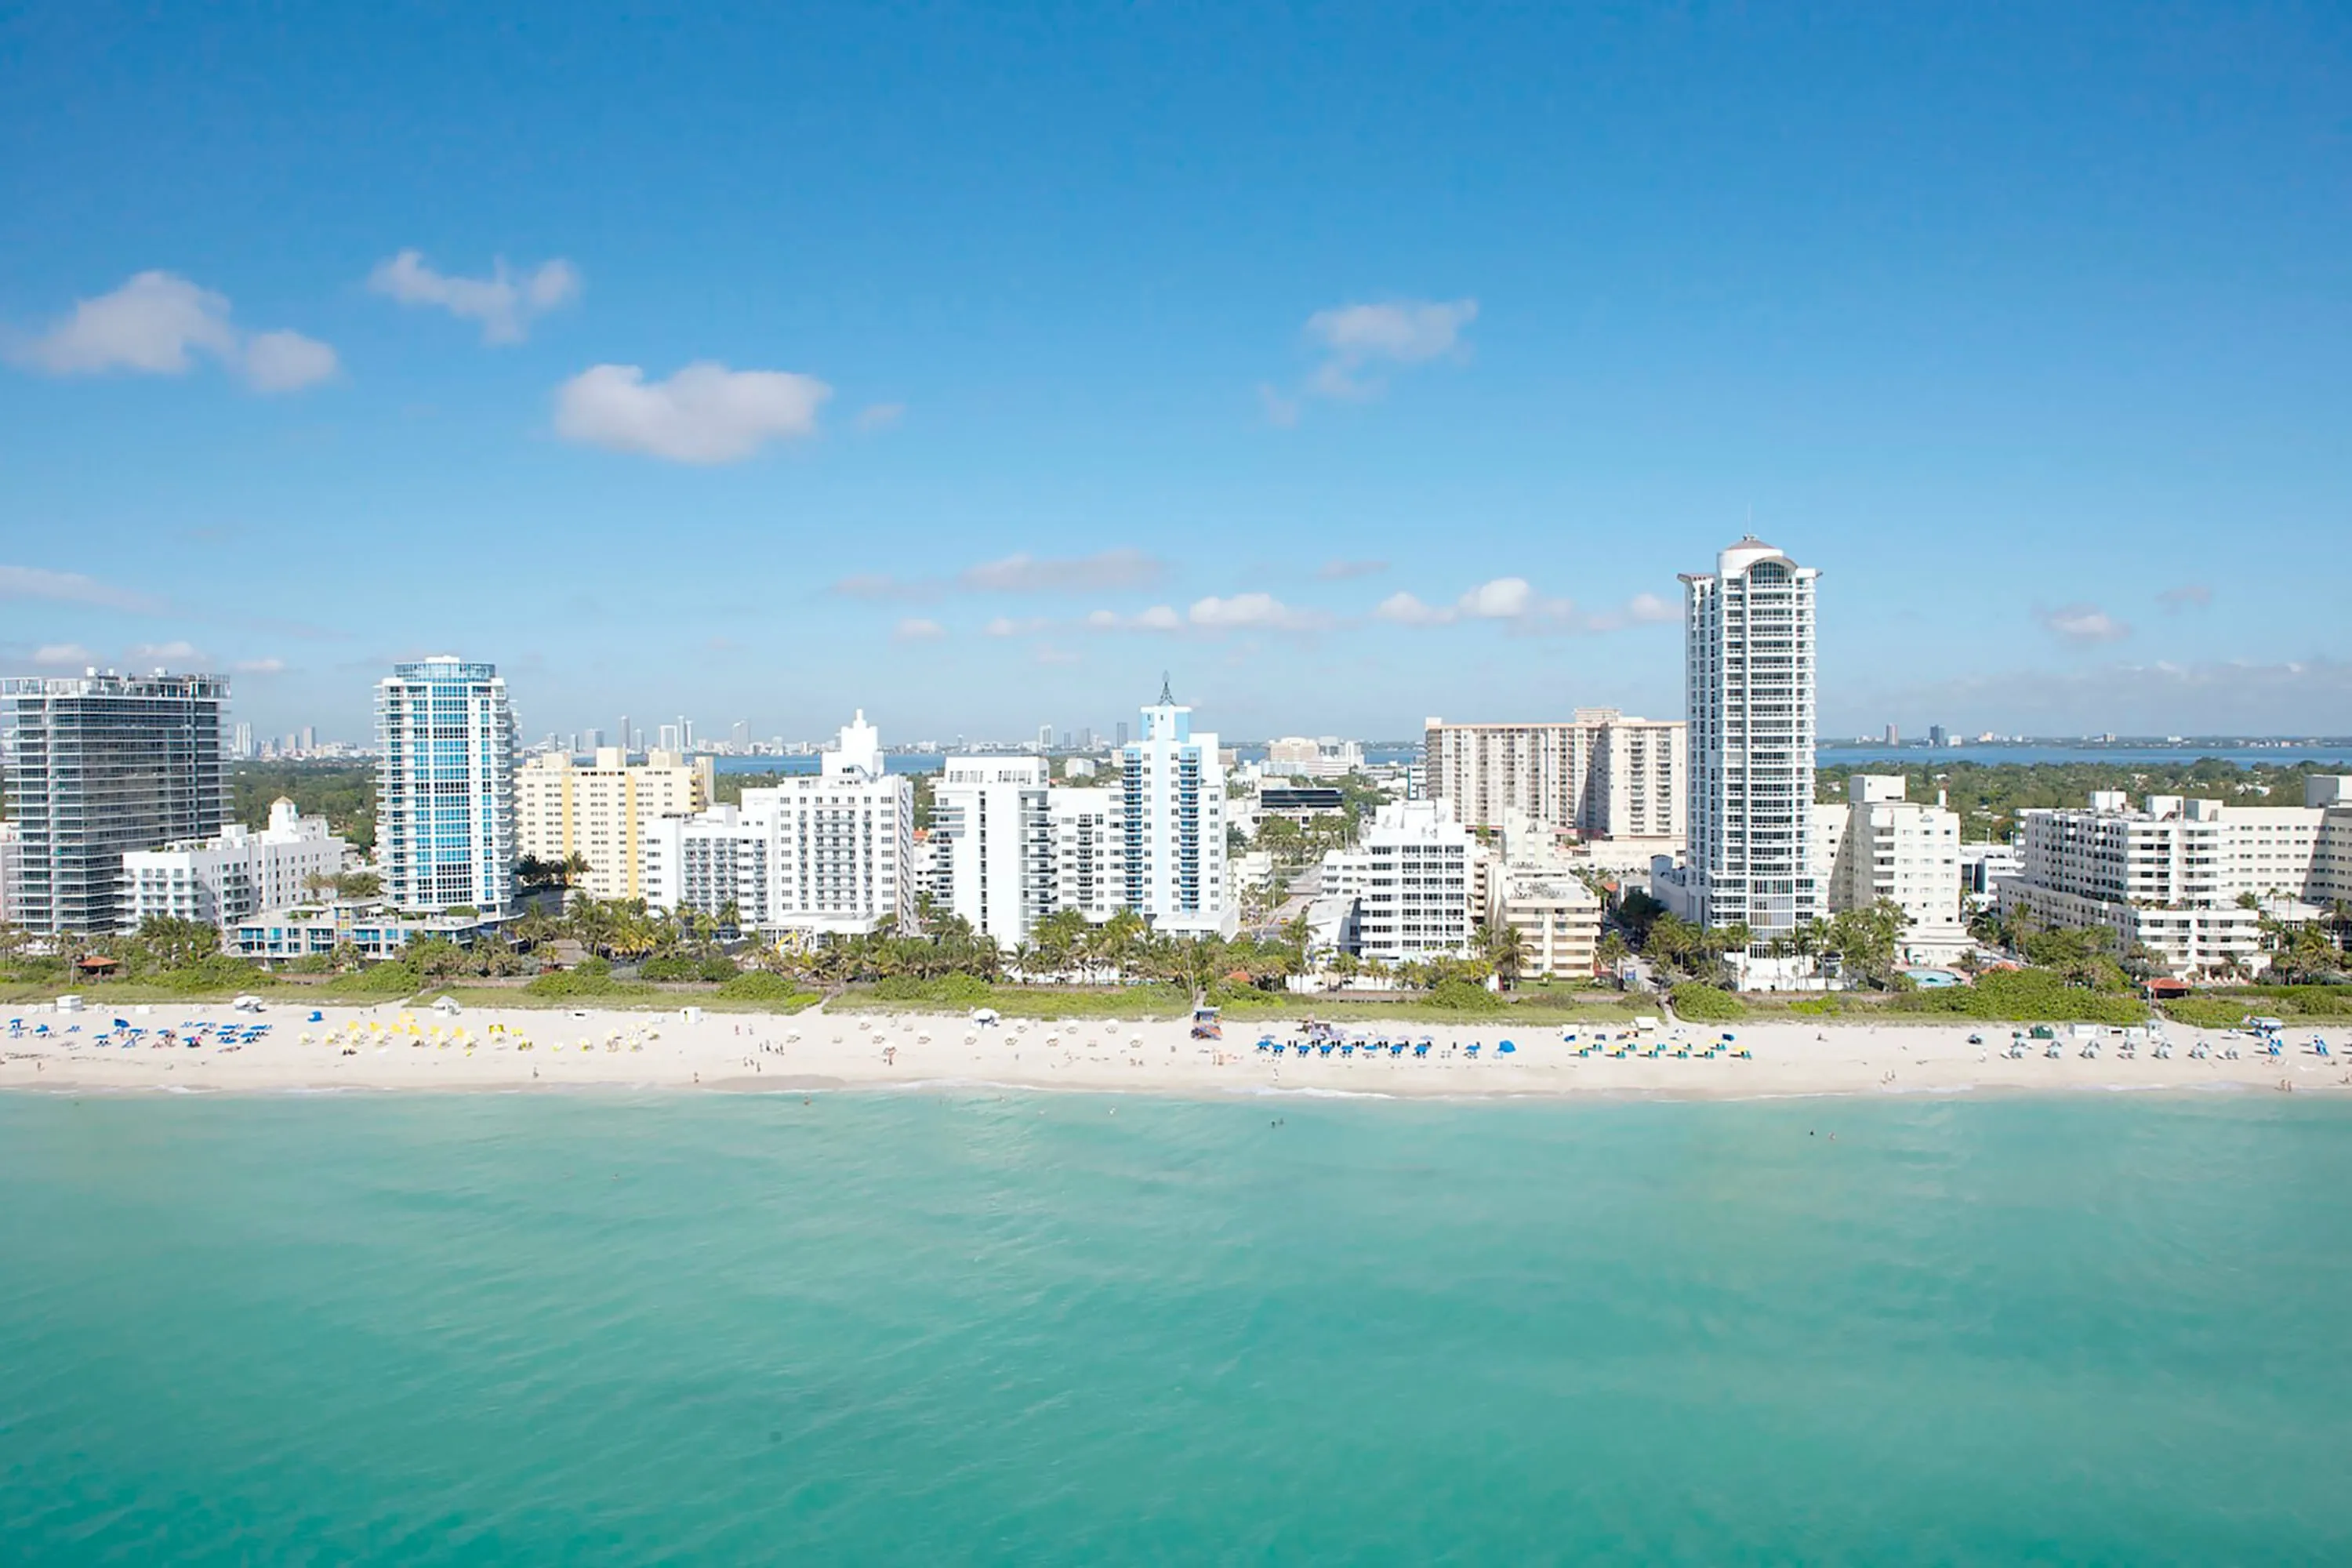
Surfside may be pocket-sized on the map, but when it comes to luxury living, this seaside town punches well above its weight. This tight-knit community sits immediately north of Miami Beach and south of Bal Harbour, and cherishes its ocean-front living options, beach walks, community center, and overall quality of life. In our years of experience as a boutique brokerage in South Florida, we’ve seen a growing luxurious side to this beach town that has brought us top-tier, ultra-luxury residences tucked inside some of the most sought-after oceanfront buildings. In this blog, we’ve ranked the top five most luxurious condos in Surfside, Miami, according to their average price per square foot and standout amenities. These sophisticated condo towers are quickly becoming the most expensive in all of Miami, rivaling the luxury and desirability of Fisher Island. You’ll also get an inside look at the neighborhood and the new pre-construction developments positioning it among South Florida’s most exclusive and desirable destinations. ##### --- ## — Why Choose to Live in Surfside? This family-oriented beach town is perfectly positioned between glamorous Bal Harbour and world-famous Miami Beach. A pocket-sized neighborhood, Surfside is somewhat of an extension of Bal Harbour and is favored by those looking for a mix of exclusivity, sense of community, friendly neighbors, safe streets and a stunning beach lifestyle. Residents love the uncrowded beaches here that come lined with scenic boardwalks and citywide exhibits dedicated to marine life (read about Surfside’s famous turtles). It also ranks as the 12th best suburb to raise a family in Miami-Dade County and 40th best suburb to live in Florida, according to niche.com. The town also has its very own community center that features a lap pool, a plunge pool, a children’s pool, a jacuzzi, and two multipurpose rooms made available to host community events. Plus, it’s home to one of the area’s best tennis centers, where you can play league tennis, or pickleball if you prefer. So, now that you know more about this lovely beachside community, here’s where you can find the best condos for sale in Surfside. ## — The Most Luxurious Condos in Surfside, Miami ### 5\. Azure Condos 9401 Collins Avenue | **Average List Price: $1,058 per square foot** Azure in Surfside embodies the elegant style that Surfside is known for, only steps from the Bal Harbour Shops, with all of its shopping and dining options, and only a few minutes' drive from one of the area’s finest golf courses. Each unit in this 12-story, boutique midrise is designed with dramatically high ceilings and floor-to-ceiling windows, maximizing natural light to create airy, open living spaces. Sliding glass doors lead to ample terraces with sweeping views of the Atlantic Ocean. Amenities in this exclusive pet-friendly building built in 2005 offer luxury and convenience, and include a social salon, a bar, a climate-controlled swimming pool, an outdoor whirlpool spa, poolside cabanas, a fitness center with cardio and strength training, and his and hers saunas. ### 4\. Rimini Beach 8911 Collins Avenue | **Average List Price: $1,125 per square foot** Since 1998, Rimini Beach has remained one of Surfside’s most quietly elegant oceanfront addresses, pairing Arquitectonica’s design with a boutique scale of just 55 residences. Its glass façade and wraparound terraces capture sweeping views of the Atlantic Ocean and Biscayne Bay. Residences feature spacious layouts with floor-to-ceiling windows and private balconies. Amenities include direct beach access, an oceanfront pool and hot tub, a fitness center, a clubroom with billiards and media, and a 24-hour attended lobby. Residents also enjoy secure garage parking, pet-friendly policies, and the comfort of a well-managed boutique building. ### 3\. Fendi Chateau Residences 9349 Collins Avenue | **Average List Price: $4,160 per square foot** The first-ever residential project by the house of Fendi, this boutique, 12-story building features 58 ultra-luxury, flow-through condos. Developed in association with the Chateau Group and designed by Arquitectonica, with landscaping by ArquitectonicaGEO, these sophisticated residences sit on 300 feet of private beachfront. The project was completed in 2016. You’re bound to enjoy Fendi-designed interiors and custom Fendi touches throughout the common spaces. Amenities in this luxury Surfside condo include two swimming pools surrounded by tropical gardens, a private restaurant, a lounge with gourmet kitchen, a spa with European thermal pool, Luxury Attaché concierge and beachside services. Last but not least, Fendi Chateau Residences is one of the exquisite Miami condos with Shabbat-friendly elevators. ### 2\. Arte by Antonio Citterio 8955 Collins Avenue | **Average List Price: $5,207 per square foot** This ultra boutique, oceanfront development is a first in the U.S. by the acclaimed international starchitect duo of Antonio Citterio and Patricia Viel. The Italian designers are famous for their elegant minimalism and uniquely European spaces. Built in 2018, the one-of-a-kind, pyramid-style, glass building features only 16 ultra-luxury condo residences across 12 stories and is perched along the finest stretch of Surfside’s beachfront. We especially appreciate its uniqueness and exclusive, boutique lifestyle. Arte’s impressive list of resort-style amenities includes an indoor heated lap pool with a water feature, a meditation pond, sauna and steam rooms, an outdoor meditation swimming pool, a yoga studio, a rooftop tennis court, a children's playroom, a resident’s lounge, and an art-adorned lobby. If you are looking for true oceanfront exclusivity and large floor plans, Arte is one of our top recommendations. ## — And the Most Luxurious Condo in Surfside Is... ### 1\. The Surf Club Four Seasons Hotel and Residences 9011-9111 Collins Avenue | **Average List Price: $5,501 per square foot** Carrying on the legacy of the historic Surf Club built on this site in 1930, this iconic condo-hotel is where you can find the most luxurious condos in Surfside, Miami for sale. It features 119 private residences and 31 hotel residences spread across 12 stories, all connected to the exclusive Surf Club Four Seasons Hotel. Architects Kobi Karp and Richard Meier have taken special care to preserve the original Surf Club structure that opened on New Year’s Eve, 1930—marking it the place to see and be seen. Today, the property restored in 2017 stands to feature the glamor of a bygone era plus luxurious modern residences for a truly exceptional lifestyle. As a resident, you will enjoy access to the hotel’s amenities such as four heated pools, beach club services, landscaped gardens, oceanfront Four Seasons spa services with the option of in-residence treatments, two restaurants with in-residence dining, and all of the spectacular services expected of a Four Seasons. If you’re a discerning buyer looking for the most luxurious condo in Surfside, Miami this extremely luxurious, historic building may be exactly what you're looking for. Personalize your Surfside Miami luxury condo search to the max with our custom filters. Contact us to compare and discuss your options. ## — The Best-Located Luxury Condo in Surfside While it’s a hard decision with all of the excellent beachfront condos in the area, we vote Fendi Chateau as the best-located condo in Surfside for several reasons. First, the designer building sits on a private slice of pristine beachfront and is only a block from the nearest Publix and the Surfside Community Center. It is also a short walk from the famous Bal Harbour Shops. ## — The Most Luxurious Pre-Construction Condos in Surfside ### The Delmore Surfside 8777 Collins Avenue | **Average List Price: $3,993 per square foot** Developed by global luxury leader DAMAC International, this 12-story ultra-boutique condominium of just 37 residences will unite the visionary architecture of Zaha Hadid Architects with the refined interior design of Hirsch Bedner Associates (HBA). Homes will start at 4,400 square feet, with 4- or 5-bedroom layouts, boasting floor-to-ceiling glass walls that frame the Atlantic Ocean and Biscayne Bay. Fully finished interiors feature spa-inspired bathrooms, custom closets, and bespoke kitchens anchored by marble islands. The Delmore’s 55,000 square feet of amenities are crowned by a 75-foot see-through rooftop swimming pool suspended 125 feet in the air, the first of its kind in Miami, and an indoor 75-foot lap pool that opens via retractable glass walls to a lush 20,000-square-foot meditation garden. Additional amenities include a residents-only restaurant, a fitness center and an indulgent spa, as well as personalized assistance from a residence manager. Watch our exclusive video review of the Most Exclusive Beachfront Properties in Miami under development where we discuss The Delmore and more. ### Ocean House Surfside 9317 Collins Avenue Ocean House Surfside pairs Arquitectonica’s design with interiors by Carla Guilhem to create an 11-story boutique collection of 25 residences shaped by contemporary elegance and the calm of the shoreline. Developed by Multiplan Real Estate Asset Management (REAM), the project offers two- to five-bedroom floor plans up to 6,000 square feet. Residences feature private elevators, 10-foot ceilings, and 12 feet deep terraces framing views of the Atlantic Ocean and Bal Harbour. Homes are expected to be delivered in 2027 fully finished with natural stone flooring, Silestone waterfall-edge kitchen islands, Gaggenau appliances, and custom cabinetry. Primary suites include spa-inspired baths with rainfall showers, freestanding soaking tubs, and expansive wardrobe space. Amenities span three levels, highlighted by a rooftop infinity pool and lounge with panoramic ocean views. Landscaped gardens feature reflecting ponds, outdoor kitchens, and private cabanas, while the wellness spa offers steam and sauna, vitality pool, salon, treatment suites, and a fitness center. Dedicated services, including 24/7 concierge, valet, and beach and pool staff, complete the lifestyle. ### 93 Ocean 9309 Collins Avenue Developed by Multiplan Real Estate Asset Management, this 12-story tower will have 27 exquisite residences, each meant to capture the spirit of luxury yacht design and the serenity of a private seaside villa. Designed by Miami’s Arquitectonica, it will have interiors by Brazilian designer Carla Guilhem, and its expected completion is 2027\. Each uniquely designed residence will feature 12-foot-deep terraces with city and ocean views, glass railings, one-of-a-kind ceilings with wood-like accents, contemporary Italian kitchens, and spa-inspired baths. Amenities will include a resistance pool and a reflecting pond along a private path leading to the beach, a rooftop pool deck, a fitness center, a steam room, a sauna, a club room, 2 to 3 parking spots per unit, and more. ### Seaway at The Surf Club 9149 Collins Avenue Seaway sits on the north end of The Surf Club as a single 12-story tower offering 34 expansive and ultra luxurious residences with wraparound terraces and glass railings. Designed by Joseph Dirand and ODP Architecture, this boutique project combines classic European modernism with contemporary design to create a beacon of luxury in Surfside. With completion expected in 2026, all residences will have breathtaking ocean views thanks to the floor-to-ceiling windows and generously scaled interiors. Seaway will offer its residents prime services by the Four Seasons brand and they will also have access to the extended amenities at The Surf Club. Both locations will be connected by a tropical pathway ideated by renowned Belgian landscape designer Peter Wirtz. ### Surf House 8995 Collins Avenue Surf House, designed by Kobi Karp, will be a lavish 11-story tower featuring 19 oversized residences. Its design merges contemporary aesthetics with natural elements, resulting in a distinctly modern structure with a magnificent glass exterior beautifully mirroring the ocean. This boutique mid-rise, expected to be completed in 2026, epitomizes opulence, boasting floor-to-ceiling glass windows that unveil spacious terraces. Moreover, this luxurious beachfront tower grants exclusive access to the pristine shoreline of the Atlantic Ocean through a sandy, foliage-adorned barefoot path. ### Surf Row Residences 8800 Collins Ave Designed by Alfonso Jurado Architecture and Boris Pena Architects, and developed by LD&D in partnership with ONE Capital and IGEQ, Surf Row is bringing the ultimate residential experience in beachfront luxury to Miami’s tranquil Surfside with only eight single-family row houses on the beach. This limited collection of 24 bespoke condominium homes will rise just a few stories along Collins Avenue, merging timeless coastal elegance with the ease of boutique living only steps from the Atlantic Ocean. The residences will showcase flowing architectural lines and a distinctly modern structure incorporated into a lush, natural landscape. Expansive floor-to-ceiling windows, curved balconies, soft materials, and light-filled interiors will frame every home in warmth and ocean air. Expected to be completed in 2027, Surf Row Residences will offer an elevated amenity collection spanning over 6,400 square feet, including a sun-drenched rooftop terrace overlooking the ocean, complete with a pool, lounge areas, and outdoor kitchens for sunset dining and relaxed gatherings. You will also enjoy private beach access with towel service, a spa and fitness center, coworking spaces, and a dedicated concierge. ## — How Safe is Surfside? As mentioned above, while Surfside is its own municipality, it has been an overall “A” grade and voted the 12th best “suburb” to raise a family in Miami-Dade in 2025 by niche.com. The neighborhood-ranking website also gives this coastal community a “B” in terms of safety. This does not come as much of a surprise, since the neighborhood is much safer compared to other cities in the U.S. Surfside also has a good police officers-to-residents ratio, making it rank highly in terms of safety. Surfside schools are also highly rated. ## — Best Restaurants in Surfside ##### Champagne Bar at the Surf Club Surfside has a variety of excellent restaurants lined up against its main street, Harding Avenue. It also has stellar dining options in some of its world-renowned condos and hotels. Some of the top-rated eateries in the neighborhood include Cafe Ragazzi for crowd-pleasing bowls of pasta and creamy tiramisu, and The Fresh Carrot for healthy eats with plenty of vegan, vegetarian, and kosher options. Head over to Josh’s Deli for traditional Jewish delights such as house-cured pastrami sandwiches, matzo ball soup, and the classic corned beef sandwich. If you’re up for sushi, Sushi Republic offers authentic Japanese dishes by a Japanese chef. The Surf Club Restaurant by Chef Thomas Keller serves gossip-worthy continental dishes revamped for today’s contemporary guest, while the Champagne Bar at The Surf Club is THE place for the best Italian fine dining and champagne with inspiring water views. Moncheese Pizza covers all your cheesy pie cravings and then some, and Serendipity Yogurt Café is a fun favorite for froyo, sorbets, and ice creams. ## — Shopping in Surfside This seaside community boasts being just next door to the most exclusive outdoor shopping mall in the U.S., The Bal Harbour Shops. Here, you’ll find relaxed, tropical shopping for almost every luxury fashion brand available. The neighborhood also has many boutiques, jewelry galleries, florists, supermarkets, and daily needs shops. You can easily find a Publix Supermarket, Publix Pharmacy, and CVS Pharmacy along Harding Avenue. There is also a Starbucks housed in Surfside Plaza. You rarely need to step out of this coastal community for shopping, although you have every option you could need just a few minutes away in Miami. Finding that choosing among the most luxurious condos for sale in Surfside is a bit challenging? Contact us for expert guidance and representation in your next purchase. Thinking of selling your Surfside condo? Call or text us for a complimentary, accurate valuation. Our multilingual luxury team is ready to assist you with discretion and expertise. **ARE WE FRIENDS ON SOCIAL MEDIA?** 📣 Connect with us on Instagram, TikTok and YouTube. 📣
Real Estate News
Market Insights
Market Reports
Miami Beach
Mid Beach
South Beach
Sunny Isles Beach
Bal Harbour
Surfside
North Beach
Miami Beach Luxury Condo Market Report Q2 2020
View the most up-to-date market reports. Take me there now! CondoBlackBook.com's overall Miami luxury condo market report for Q2 2020 unveiled the full impact the global health crisis had on sales, prices and other metrics as part of our quarterly analysis. As expected, sales slowed down and, as a result, inventory levels went up. The days condos spent on the market declined, however, that was more so due to sellers temporarily taking properties off the market and in part due to improved buyer-seller dialogue. Good news came in the form of sales prices holding their own – even posting gains - showing that sellers still got good value for their luxury condos, irrespective of a global slowdown. Miami Beach was the only grouping in our first quarter study to report a (18.3%) drop in year-over-year sales. So, as the global health crisis unfolded during the second quarter, it was unclear how one of the most popular cities in the world would fare, however it seems that the beaches managed to hold their own. South Beach went from being the worst performing overall Miami neighborhood to one of three most stable in 2Q20 – besides Fisher Island and Edgewater – reporting minimal loss in momentum. Prices also showed resilience, showing gains in most sub-markets – a positive sign for owners of luxury condos in Miami Beach. In this second-quarter report, find details on how each Miami Beach sub-neighborhood fared during the peak of the pandemic and its correlation to the overall market. Read on for the complete analysis: --- ###### Disclaimer: Data sourced from MLS 9 April 2020\. Precaution has been taken to ensure that the content and analysis is accurate and current, however figures may be subject to revision. --- ###### Disclaimer: Data sourced from MLS 9 April 2020\. Precaution has been taken to ensure that the content and analysis is accurate and current, however figures may be subject to revision. --- ###### Disclaimer: Data sourced from MLS 9 April 2020\. Precaution has been taken to ensure that the content and analysis is accurate and current, however figures may be subject to revision. _For the purposes of this report, we've included the sub-neighborhoods of South Beach, Mid-Beach, North-Beach, Sunny Isles Beach, Surfside, Bal Harbour, and Fisher Island as part of our Miami Beach grouping. Also, this luxury condo submarket report only features properties priced at $1 million and above._ **Miami Beach Luxury Condo Market 2Q20 Highlights:** * Sales drop 50.7% year-over-year due to COVID-related global slowdown * 12-month Sales Trendline stays negative from 1Q20 to 2Q20 * Price/Sq. Ft. up 10.7% year-over-year & 10% quarter-over-quarter * Median Sales Price down 3.5% year-over-year * Days on Market down 33.6% year-over-year * Inventory at highest since March 2019 **Miami Beach Sub-neighborhood 2Q20 Highlights:** * Fisher Island and South Beach weather pandemic-related slowdown best, reporting only a 25% and 26% dip in year-over-year Sales, respectively * Mid-North Beach most affected by global health crisis-related slowdown, reports biggest percentage (67.9%) drop in year-over-year Sales * 12-Month Trendline flat for South Beach only - all other sub-neighborhoods negative * Fisher Island is most expensive neighborhood in all of Miami, priced at $1,101/sq. ft., overtaking Surfside & Bal Harbour from Q1 * Fisher Island also posts highest percentage increase (34.8%) in Price/Sq. ft. in Miami Beach * South Beach reports highest percentage decrease (15%) in Price/Sq. ft. in Miami Beach * Surfside & Bal Harbour posts highest Median Sales Price of $2.4 million in all of Miami, just behind the perpetually high-priced Fisher Island ($4.9 million) * Surfside & Bal Harbour posts highest percentage increase (13%) in Days on Market in Miami Beach * Fisher Island posts highest percentage decrease (37.7%) in Days on Market in Miami Beach * Surfside & Bal Harbour report lowest inventory (31 months) in Miami Beach and second-lowest in Miami overall, followed closely by South Beach (36 months) * Sunny Isles Beach posts highest inventory (90 months) in Miami Beach ## Table of Contents 1. Overall Miami Beach Luxury Condo Market Trends 2. South Beach Luxury Condo Market Trends 3. Mid and North Beach Luxury Condo Market Trends 4. Surfside & Bal Harbour Luxury Condo Market Trends 5. Sunny Isles Beach Luxury Condo Market Trends 6. Fisher Island Luxury Condo Market Trends 7. Conclusion **Miami Beach Luxury Condo Market Summary 2Q20 - Fig. 1** **Number of Sales** **Median Sale Price** **Quarters** **Median Sp/Sqft** **% Change in Sales** **% Change in Median Sale Price** **% Change in Median Sp/Sqft** **Median of DOM** **72** $1,700,000 2020 Q2 $941.00 \-50.7% \-3.5% 10.7% 99 **146** $1,762,500 2019 Q2 $850.00 149 ## Miami Beach Luxury Condo Sales Down YoY 50.7% drop in year-over-year Sales with negative trendline. Miami Beach had a very soft opening to the year, with an 18.3% drop in year-over-year Sales reported in the first-quarter. However, with the COVID-19 situation unfolding globally and the city going into lockdown for the months of March and April, the second quarter, which is supposed to be the strongest of the year, was expected to report a further slowdown in momentum. As anticipated, Miami Beach reported a 50.7% decline in year-over-year Sales, much in sync with the overall market trend this quarter. A look at the Monthly Sales chart in Fig. 2.2 shows that after peaking in March to 51, sales gradually slipped to 31 in April (against 58 last year) and further to 19 in May (against 53 last year). However, a second look reveals that numbers started rising by the tail-end of the quarter, as June closed with 22 sales (closer in number to previous year's 35 sales). This shows that pent up demand started trickling back in as the world adjusted to the "new normal" of doing business. Consistent with the decline in sales, the 12-month trendline too remained negative between Q1 and Q2 this year (Fig. 2.3). However, as we've noticed a surge in sales going into July, it will be worth focusing on individual quarter growth to find signs of a recovery, since we do not anticipate 2020 recovering to 2019 numbers as yet. --- ###### Disclaimer: Data sourced from MLS 9 April 2020\. Precaution has been taken to ensure that the content and analysis is accurate and current, however figures may be subject to revision. --- ###### Disclaimer: Data sourced from MLS 9 April 2020\. Precaution has been taken to ensure that the content and analysis is accurate and current, however figures may be subject to revision. --- ###### Disclaimer: Data sourced from MLS 9 April 2020\. Precaution has been taken to ensure that the content and analysis is accurate and current, however figures may be subject to revision. ## Miami Beach Luxury Condo Price/Sq. Ft. Up, Sales Price Down **Price per Sq. ft. up 10.7% to $941, Median Price down 3.5% year-over-year.** Partly in line with the general market trend, Miami Beach reported an increase in price/sq. ft. with a slight decline in Median Sales Price, as opposed to an increase in both metrics for Miami overall. This difference in trends could be due to the newer set of luxury condos being smaller in size but packing in more amenities, naturally making them fetch a higher price per sq. ft. The Price per Sq. Ft. increases 10.7%, up from $850 in the same quarter of 2019 to $941 this year. On the other hand, the Median Sales Price slipped 3.5%, adjusting from $1,762,500 in the same quarter last year to $1,700,000 this year (fig. 1). A look at the five-year snapshot of quarterly prices per sq. ft. below (fig. 3) reveals that prices closed in the mid ranges for the period under review - 10% higher than the previous quarter, indicating good value for owners. --- ###### Disclaimer: Data sourced from MLS 9 April 2020\. Precaution has been taken to ensure that the content and analysis is accurate and current, however figures may be subject to revision. ## Days on Market Down YoY in Miami Beach **33.6% decline in year-over-year Days on Market** **.** Consistent with the overall market trend, luxury condos in Miami Beach spent 50 fewer days on the market compared to the same quarter in 2019 (fig. 4). On a quarter-to-quarter basis as well, luxury condos spent 44 fewer days on market. This decline is a positive indicator, showing that buyers and sellers found it easier to reach a consensus in this combined beach district even as the pandemic ensued. However, it will be interesting to note how the metric reacts once the market returns to its pre-COVID momentum. --- ###### Disclaimer: Data sourced from MLS 9 April 2020\. Precaution has been taken to ensure that the content and analysis is accurate and current, however figures may be subject to revision. ## Miami Beach Inventory Up to Highest Since Mar. 2019, Favors Buyers **Q2 closes with 55 months of inventory.** Consistent with the overall market trend, Miami Beach's luxury condo inventory increased 57.1% year-over-year, reaching 55 months this June-end from previous year's 35 months. On a quarter-to-quarter basis too, inventory increased by 31%, up from March's closing of 42 months (fig. 5). With levels moving further away from the 9-12-month benchmark of a balanced market (expectedly), buyers have the added advantage of time and choices to fish out the best deals in this collective beach district. To see the kind of luxury condos available for sale in Miami Beach, click here. --- ###### Disclaimer: Data sourced from MLS 9 April 2020\. Precaution has been taken to ensure that the content and analysis is accurate and current, however figures may be subject to revision. _A balanced market has only 9-12 months of inventory. The months of inventory are calculated as – no. of active listings + no. of pending listings divided by the average number of deals in the last 6 months._ ## Miami Beach Neighborhoods: South Beach (ZIP 33139) **South Beach Luxury Condo Market Summary 2Q20 - Fig. 6** **Number of Sales** **Median Sale Price** **Quarters** **Median Sp/Sqft** **% Change in Sales** **% Change in Median Sale Price** **% Change in Median Sp/Sqft** **Median of DOM** **28** $1,777,500 2020 Q2 $1,079.00 \-26.3% \-8.3% \-15.0% 78 **38** $1,937,500 2019 Q2 $1,270.00 132 --- ###### Disclaimer: Data sourced from MLS 9 April 2020\. Precaution has been taken to ensure that the content and analysis is accurate and current, however figures may be subject to revision. ## South Beach: Sales Down YoY, But One of Most Stable in Miami **Q2 sales show stability with only 26% dip year-over-year and flat trendline.** From posting the lowest Sales (-38.1%) of all Miami neighborhoods in the previous quarter, South Beach makes a comeback this second-quarter by posting a minimal loss in sales momentum. One of only three neighborhoods in our study reporting a minimal decline (26%) in year-over-year sales, South Beach is only behind Edgewater and Fisher Island in terms of stability. This resilience is further substantiated by a flat 12-month trendline in fig. 7.2, which picks up from a negative angle in the previous quarter. --- ###### Disclaimer: Data sourced from MLS 9 April 2020\. Precaution has been taken to ensure that the content and analysis is accurate and current, however figures may be subject to revision. --- ###### Disclaimer: Data sourced from MLS 9 April 2020\. Precaution has been taken to ensure that the content and analysis is accurate and current, however figures may be subject to revision. ## South Beach: Luxury Condo Drop YoY to Second-Most Expensive in Miami **Price/sq. ft. drops 15% year-over-year to $1,079, median price down 8.3% year-over-year.** In contrast to the overall market trend in Miami, both the Price per Sq. ft. and Median Sales Price dipped in South Beach (fig. 6). The Price per Sq. Ft. dipped 15%, the biggest percentage drop in price/sq. ft. in all of Miami, down from $1,270 in the same quarter of 2019 to $1,079 this year. The Median Sales Price also declined 8.3%, down from $1,937,500 in Q2 last year to $1,777,500 this year. A look at the five-year snapshot of quarterly prices below (fig. 8) reveals that the price per sq. ft. trended in the mid ranges of the period under review, still up 17% compared to Q1. --- ###### Disclaimer: Data sourced from MLS 9 April 2020\. Precaution has been taken to ensure that the content and analysis is accurate and current, however figures may be subject to revision. ## South Beach: Days on Market Drop YoY **40.9% decline in year-over-year Days on Market.** Consistent with the overall market trend, South Beach's luxury condos spent 54 fewer days on the market (median) compared to the same quarter of 2019, and a good 130 fewer days compared to Q1 this year (fig. 9). This is a positive indication for the sub-neighborhood, showing that buyers and sellers had smoother interactions in this popular neighborhood. --- ###### Disclaimer: Data sourced from MLS 9 April 2020\. Precaution has been taken to ensure that the content and analysis is accurate and current, however figures may be subject to revision. ## South Beach: Inventory Increases YoY, Stable QoQ **Q2 inventory closes at 36 months.** In sync with the overall market trend in Miami, South Beach's luxury condo Inventory increased 33.3% year-over-year, up from 29 months in June last year (fig. 10). However, the good news is that inventory is only slightly higher than March's closing of 35 months. Still, even after reporting a minimal loss in sales momentum, inventory will take a while to settle down to the 9-12-month benchmark of an ideal market. Until then, buyers can search South Beach condos for sale here to find the best deals in this desirable market. --- ###### Disclaimer: Data sourced from MLS 9 April 2020\. Precaution has been taken to ensure that the content and analysis is accurate and current, however figures may be subject to revision. ## Miami Beach Neighborhoods: Mid and North Beach (ZIP 33140 & 33141) **Mid-Beach and North-Beach Luxury Condo Market Summary 2Q2020 - Fig. 11** **Number of Sales** **Median Sale Price** **Quarters** **Median Sp/Sqft** **% Change in Sales** **% Change in Median Sale Price** **% Change in Median Sp/Sqft** **Median of DOM** **9** $1,275,000 2020 Q2 $863.00 \-67.9% 1.2% 6.0% 118 **28** $1,260,000 2019 Q2 $814.00 119 --- ###### Disclaimer: Data sourced from MLS 9 April 2020\. Precaution has been taken to ensure that the content and analysis is accurate and current, however figures may be subject to revision. ## Mid-North Beach: Luxury Condo Sales Slip to Lowest in Miami Beach **67.9% drop in year-over-year Sales with negative trendline.** With the second-highest percentage drop in year-over-year sales of all the neighborhoods in our study, just behind Brickell, Mid-North Beach also reports the biggest drop in total quarterly sales in Miami Beach. Bearing the maximum impact of a COVID-related loss in momentum of all the beaches, Mid-North Beach posts a 67.9% decline against the same quarter last year (fig. 11). The 12-month trendline goes from flat in the previous quarter to negative this quarter in response to the slowdown (fig. 12.2), showing that this quieter set of beach neighborhoods could take a while to recover. --- ###### Disclaimer: Data sourced from MLS 9 April 2020\. Precaution has been taken to ensure that the content and analysis is accurate and current, however figures may be subject to revision. --- ###### Disclaimer: Data sourced from MLS 9 April 2020\. Precaution has been taken to ensure that the content and analysis is accurate and current, however figures may be subject to revision. ## Mid-North Beach: Prices Down - Biggest Drop in Miami Beach and Miami Overall **Price per sq. ft. up 6% at $863, Median Price flat year-over-year.** Consistent with the overall market trend of increasing prices, Mid-North Beach reported a 6% in its Price per Sq. Ft., up from $814 in the same quarter of 2019 to $863 this year. The Median Sales Price was mostly flat (+1.2%), adjusting from $1,260,000 in the same quarter last year to $1,275,000 this year (fig. 11). A look at the five-year snapshot of quarterly prices per sq. ft. below (fig. 13) reveals that prices trended closer to the lower-end of the range for the period under review, only 3.1% higher than the first-quarter this year. --- ###### Disclaimer: Data sourced from MLS 9 April 2020\. Precaution has been taken to ensure that the content and analysis is accurate and current, however figures may be subject to revision. ## Mid-North Beach: Days on Market Flat YoY **Days on Market stay flat year-over-year.** Deviating from the overall market trend in Miami, Mid-North Beach's luxury condos spent barely 1 fewer days on the market compared to the same quarter of 2019 and 10 less days compared to Q1 this year (fig. 14). This is a positive indication for the sub-neighborhood, showing that buyers and sellers mostly saw eye-to-eye on dealings. --- ###### Disclaimer: Data sourced from MLS 9 April 2020\. Precaution has been taken to ensure that the content and analysis is accurate and current, however figures may be subject to revision. ## Mid-North Beach: Inventory Up to Record-High **Q2 closes with 60 months of Inventory.** Consistent with the overall market trend in Miami, Mid-North Beach's luxury condo Inventory increased 106.9% over June-closing last year (29 months) and 100% over March's closing of 30 months this year. Moving the furthest the neighborhood has been to reaching the 9-12-month benchmark of an ideal market, buyers have a great window of opportunity to drive negotiations in their favor. To find what kind of luxury condos are available in these coastal districts, search North Beach and Mid-Beach condos for sale here. --- ###### Disclaimer: Data sourced from MLS 9 April 2020\. Precaution has been taken to ensure that the content and analysis is accurate and current, however figures may be subject to revision. _A balanced market has only 9-12 months of inventory. The months of inventory are calculated as – no. of active listings + no. of pending listings divided by the average number of deals in the last 6 months._ ## Miami Beach Neighborhoods: Surfside & Bal Harbour **Surfside & Bal Harbour Luxury Condo Market Summary 2Q20 - Fig. 16** **Number of Sales** **Median Sale Price** **Quarters** **Median Sp/Sqft** **% Change in Sales** **% Change in Median Sale Price** **% Change in Median Sp/Sqft** **Median of DOM** **11** $2,441,000 2020 Q2 $879.00 \-50.0% 22.8% \-1.4% 130 **22** $1,987,500 2019 Q2 $891.00 115 --- ###### Disclaimer: Data sourced from MLS 9 April 2020\. Precaution has been taken to ensure that the content and analysis is accurate and current, however figures may be subject to revision. ## Surfside & Bal Harbour: Luxury Condo Sales Down **50% drop in year-over-year sales with negative trendline.** Consistent with the overall market slowdown in Miami, this combined beach neighborhood reports a 50% decline in year-over-year sales (fig. 16). Further, the 12-month trendline in fig. 17.2 captures this pandemic-led loss in momentum as well, as it goes from flat in Q1 to negative in Q2. --- ###### Disclaimer: Data sourced from MLS 9 April 2020\. Precaution has been taken to ensure that the content and analysis is accurate and current, however figures may be subject to revision. --- ###### Disclaimer: Data sourced from MLS 9 April 2020\. Precaution has been taken to ensure that the content and analysis is accurate and current, however figures may be subject to revision. ## Surfside & Bal Harbour: Sales Price Up to One of Most Expensive in Miami **Price/sq. ft. flat at $879, median price up 22.8% to one of highest in Miami.** Partly deviating from the general 2Q20 Miami luxury condo market trend, this combined neighborhood posts a flat price/sq. ft. with increased median sales price compared to an increase in both metrics in the overall report. The Price per Sq. Ft. dipped a marginal 1.4%, down from $879 in the same quarter last year to $891 this year (fig. 16). However, the Median Sales Price went up 22.8%, from $1,987,500 in the same quarter of 2019 to $2,441,000 this year – becoming the neighborhood with the second highest median sales price in Miami, right behind Fisher Island (which perpetually has the highest-priced luxury condos in all of Miami and the Miami Beaches). A look at the five-year snapshot of quarterly prices per sq. ft. below (fig. 18) reveals that prices closed in the lower ranges for the period under review, 35.1% lower than the previous quarter's record-high. --- ###### Disclaimer: Data sourced from MLS 9 April 2020\. Precaution has been taken to ensure that the content and analysis is accurate and current, however figures may be subject to revision. ## Surfside & Bal Harbour: Days on Market Up YoY **13% increase in year-over-year Days on Market.** Going against the overall Miami condo market trend for 2Q20, this combined neighborhood posted a 13% increase in year-over-year numbers. Luxury condos spent 15 more days on the market compared to the same quarter last year (fig. 19). On a quarter-to-quarter basis, however, Surfside & Bal Harbour's luxury condos spent 52 fewer days on the market, down from 182 in Q1 this year to 130 in Q2\. It will be interesting to note how this metric reacts in the third quarter as the market settles into its pre-COVID momentum. --- ###### Disclaimer: Data sourced from MLS 9 April 2020\. Precaution has been taken to ensure that the content and analysis is accurate and current, however figures may be subject to revision. ## Surfside & Bal Harbour: Inventory Up YoY, But Lowest in Miami Beach **Q2 closes with 31 months of Inventory.** Even though inventory increased (10.7%) year-over-year, much in line with the overall market trend in Miami, the combined Surfside and Bal Harbour neighborhood reports the lowest levels of inventory in Miami Beach and the second-lowest in all of Miami (just behind Coral Gables and Coconut Grove). At 31 Months, inventory is up 10.7% from the previous year's June-closing of 28 months and 24% higher than March-end's 25 months (fig. 20). However, the grouping still continues holding onto its rank of 'neighborhood with second-lowest inventory in Miami' from the first-quarter, and is poised to be one of the first to reach the ideal benchmark of 9-12 months in Miami Beach. Until then, buyers interested in this niche beachside neighborhood should make the most of the opportunity, before prices get any higher, by searching for top deals in Surfside or Bal Harbour condos for sale here. --- ###### Disclaimer: Data sourced from MLS 9 April 2020\. Precaution has been taken to ensure that the content and analysis is accurate and current, however figures may be subject to revision. _A balanced market has only 9-12 months of inventory. The months of inventory are calculated as – no. of active listings + no. of pending listings divided by the average number of deals in the last 6 months._ ## Miami Beach Neighborhoods: Sunny Isles Beach **Sunny Isles Beach Luxury Condo Market Summary 2Q20 - Fig. 21** **Number of Sales** **Median Sale Price** **Quarters** **Median Sp/Sqft** **% Change in Sales** **% Change in Median Sale Price** **% Change in Median Sp/Sqft** **Median of DOM** **17** $1,350,000 2020 Q2 $606.00 \-63.0% \-27.8% \-12.5% 99 **46** $1,870,000 2019 Q2 $693.00 149 --- ###### Disclaimer: Data sourced from MLS 9 April 2020\. Precaution has been taken to ensure that the content and analysis is accurate and current, however figures may be subject to revision. ## Sunny Isles: Luxury Condo Sales Down YoY **63% drop in year-over-year Sales with negative trendline.** Consistent with the overall market trend in Miami of lower sales, Sunny Isles Beach reports a 63% loss in momentum compared to the previous year (fig. 21). Absorbing the full impact of the global slowdown, the 12-month trendline also stays negative from 1Q20 to 2Q20 (fig. 22.2), showing that the neighborhood will take a while to recover. --- ###### Disclaimer: Data sourced from MLS 9 April 2020\. Precaution has been taken to ensure that the content and analysis is accurate and current, however figures may be subject to revision. --- ###### Disclaimer: Data sourced from MLS 9 April 2020\. Precaution has been taken to ensure that the content and analysis is accurate and current, however figures may be subject to revision. ## Sunny Isles: Luxury Condo Price/Sq. ft. Down to Lowest in Miami **Price/sq. ft. down 12.5% to lowest in Miami at $606, Median Price down 27.8% year-over-year.** Going against the overall market trend of increasing prices, Sunny Isles Beach posts the second-highest percentage drop in Price/sq. ft. in our study, bringing prices to the lowest of all Miami neighborhoods (replacing Coral Gables and Coconut Grove from Q1). The Price per Sq. Ft. decreased 12.5%, down from $693 in the same quarter of 2019 to $606 this year. Following suit, the Median Sales Price also dropped 27.8%, down from $1,870,000 the same quarter last year to $1,350,000 this Q2 (fig. 21). A closer look into quarterly price patterns mapped in fig. 23 reveals that Sunny Isles closed Q2 with the lowest price per sq. ft. for the entire period under review, also down 20.3% from Q1. --- ###### Disclaimer: Data sourced from MLS 9 April 2020\. Precaution has been taken to ensure that the content and analysis is accurate and current, however figures may be subject to revision. ## Sunny Isles: Days on Market Down YoY **27.3% drop in year-over-year Days on Market.** Consistent with the overall market trend in Miami, luxury condos in Sunny Isles Beach spent 44 fewer days on market compared to the same quarter of 2019 and 4 fewer days compared to Q1 this year (fig. 24). This shows positive interaction between buyers and sellers in the sub-neighborhood. --- ###### Disclaimer: Data sourced from MLS 9 April 2020\. Precaution has been taken to ensure that the content and analysis is accurate and current, however figures may be subject to revision. ## Sunny Isles: Inventory Up to Highest in Miami Beach, Buyers' Gain Q2 closes with 90 months of Inventory. In sync with the overall market trend in Miami, Sunny Isles' luxury condo Inventory increased 80% over June-closing last year (50 months) and 28.6% over March's closing of 70 months this year (fig. 25). With the heaviest inventory in all of Miami Beach, the neighborhood has moved further away from the 9-12-month benchmark of a balanced market. This, combined with lower prices per square foot, gives buyers a larger window of opportunity to find the best deals and drive negotiations in their favor, as they search Sunny Isles Beach condos for sale here. --- ###### Disclaimer: Data sourced from MLS 9 April 2020\. Precaution has been taken to ensure that the content and analysis is accurate and current, however figures may be subject to revision. _A balanced market has only 9-12 months of inventory. The months of inventory are calculated as – no. of active listings + no. of pending listings divided by the average number of deals in the last 6 months._ ## Miami Beach Neighborhoods: Fisher Island **Fisher Island Luxury Condo Market Summary 1Q20 - Fig. 26** **Number of Sales** **Median Sale Price** **Quarters** **Median Sp/Sqft** **% Change in Sales** **% Change in Median Sale Price** **% Change in Median Sp/Sqft** **Median of DOM** **7** $4,850,000 2020 Q2 $1,314.00 \-36.4% 148.7% 34.8% 94 **11** $1,950,000 2019 Q2 $975.00 151 --- ###### Disclaimer: Data sourced from MLS 9 April 2020\. Precaution has been taken to ensure that the content and analysis is accurate and current, however figures may be subject to revision. ## Fisher Island: Sales Down YoY, But Most Stable in Miami Q2 Sales showcase stability with only 25% slip in year-over-year sales and negative trendline. As the only sub-neighborhood in Miami Beach to report positive sales figures in 1Q20, Fisher Island continued its resilience into the second-quarter, posting the least impact of pandemic-related buyer hesitation on sales. With only a 25% drop in year-over-year sales, Fisher Island is one of only three Miami neighborhoods in our study reporting minimal sales loss in Q2 (the other two being Edgewater and South Beach). However, the 12-month trendline stays negative from 1Q20 to 2Q20, simply for not being able to match the momentum of higher than average sales registered in Q3 2019 (fig. 27.1). --- ###### Disclaimer: Data sourced from MLS 9 April 2020\. Precaution has been taken to ensure that the content and analysis is accurate and current, however figures may be subject to revision. --- ###### Disclaimer: Data sourced from MLS 9 April 2020\. Precaution has been taken to ensure that the content and analysis is accurate and current, however figures may be subject to revision. ## Fisher Island: Luxury Condo Prices Up YoY to Most Expensive in Miami **Fisher Island price/sq. ft. up 34.8% at $1,101, median sales price up 148.7% year-over-year.** Fisher Island regains its No. 1 spot in terms of Price/sq. ft. and Median Sales Price this quarter, following the overall Miami luxury condo market trend of increase in prices. Replacing the first quarter's most expensive district of Surfside & Bal Harbour, the coveted island neighborhood reports a 34.8% increase in year-over-year prices to close at $1,101/sq. ft. in Q2. Also maintaining its first-quarter top position, the water-bound neighborhood reports the highest percentage growth (148.7%) in Median Sales Price of all Miami neighborhoods in Q2, closing at a median of $4.9 million. This is mainly due to the sale of properties priced $2.5 million and upwards only this second-quarter. A look at the five-year snapshot of quarterly prices below (fig. 28), further reveals that the price per sq. ft. trended in the mid-ranges of the period under review, just 16.3% higher than Q1. --- ###### Disclaimer: Data sourced from MLS 9 April 2020\. Precaution has been taken to ensure that the content and analysis is accurate and current, however figures may be subject to revision. ## Fisher Island: Days on Market Down YoY **37.7% drop in year-over-year Days on Market.** In line with the overall Miami condo market trend, Fisher Island's luxury condos spent 57 fewer days on the market compared to the same quarter of 2019\. However, on a quarter-over-quarter basis, luxury condos spent 22 more days compared to Q1 this year (fig. 6). It will be interesting to note how the metric reacts once momentum is back to pre-COVID levels. --- ###### Disclaimer: Data sourced from MLS 9 April 2020\. Precaution has been taken to ensure that the content and analysis is accurate and current, however figures may be subject to revision. ## Fisher Island: Buyers Gain Advantage with Higher Quarter-end Inventory Q2 closes with 61 months of Inventory. In line with the overall market trend in Miami, Fisher Island's luxury condo Inventory jumped 69.4% over June-closing last year (36 months) and 27% over March's closing of 72 months this year. Even as the neighborhood posted the lowest loss in momentum of all Miami neighborhoods, inventory has moved further away from the 9-12-month benchmark of a balanced market. This puts the advantage of time and choice in buyers' hands as the metric will take a while to settle to its ideal numbers. To make the most of this opportunity, begin with a search of available Fisher Island condos for sale here. --- ###### Disclaimer: Data sourced from MLS 9 April 2020\. Precaution has been taken to ensure that the content and analysis is accurate and current, however figures may be subject to revision. _A balanced market has only 9-12 months of inventory. The months of inventory are calculated as – no. of active listings + no. of pending listings divided by the average number of deals in the last 6 months._ ## Conclusion With the world slowing down due to the ongoing coronavirus health crisis, it was quite expected to see a slowdown in overall sales for Miami and Miami Beach. And, the second-quarter numbers do show the full impact of this wild card of a situation. Sales in Miami Beach declined across the board, much like the rest of Miami (as seen in our overall report), with only South Beach and Fisher Island showing minimal loss of momentum. This in turn brought the 12-month Sales Trendline to a negative in all the Miami Beach neighborhoods, except South Beach (which was flat). This makes South Beach stand out as a strong favorite among buyers – most likely to be one of the first Miami Beach neighborhoods to report a robust sales cycle. On the price front, the majority of Miami Beach neighborhoods reported an increase in year-over-year Price/Sq. Ft., in line with the trends seen in the overall report. This showed that sellers continued getting good value for their properties, irrespective of the pandemic. The only exceptions to this were the sub-markets of South Beach and Sunny Isles Beach, of which Sunny Isles turned out to be the lowest priced of all Miami neighborhoods part of our study. At $606/sq. ft., Sunny Isles offers the most affordable entry into the Miami Beach luxury condo market for investors or buyers in South Florida. Other good news was that the Days on Market metric was down across the board, much like the overall market, with only Surfside & Bal Harbour reporting an increase. In terms of months of Inventory, the metric was naturally higher for all Miami Beach neighborhoods, keeping the market buyer friendly again. Sunny Isles Beach continued carrying the heaviest inventory for the second quarter in a row, which, coupled with its price drop, makes it an even more lucrative avenue for investments. With the market having faced the full impact of the pandemic-induced slowdown, it's expected that this wild card will continue disrupting travel plans, perhaps affecting numbers in the upcoming quarters. Another wild card to watch for this year is the Presidential election, which has historically led to buyer hesitation. Nonetheless, going into the third quarter, we can safely report that there is a sudden surge in sales due to pent up demand coming through. Also, Miami Beach still ranks high on the buyer's lists for its zero income tax, great year-round weather and proactive leadership. However, considering the market has entered into an extended buyer-friendly cycle, investors and those looking to live in Miami Beach will find it easier to find the right luxury condo at a price convenient to them and likely below recent historical markets. **Metrics** **Overall Miami** **Miami Beach** **South Beach** **Mid-North Beach** **Surfside & Bal Harbour** **Sunny Isles Beach** **Fisher Island** **Sales** Down Down Down Down Down Down Down **Trendline** Down Down Flat Down Down Down Down **Price per Sq. Ft** Up Up Down Up Flat Down Up **Days on Market** Down Down Down Flat Up Down Down **Inventory** Up Up Up Up Up Up Up Love what you see? Don't forget to share our blog and subscribe (see the subscribe link on the top menu) to receive the latest market news in your inbox. --- Questions or comments with the stats? Interested in buying a Miami Beach condo in one of these neighborhoods? Please contact Sep at sniakan (at) hbroswell.com or call 305-725-0566. ###### Cover photo credit: Antonio Cuellar
Real Estate News
Market Insights
Market Reports
Mid Beach
South Beach
Brickell
Downtown Miami
Sunny Isles Beach
Bal Harbour
Coconut Grove
Miami Luxury Condo Market Report - Q3 2020
View the most up-to-date market reports. Take me there now! Condo Blackbook's exclusive 3Q 2020 analysis of Miami's luxury condo market shows that this segment of the residential real estate market, like single-family, is mounting a strong recovery from any initial COVID-19 pandemic effects. _**Sales recovered to post the strongest third quarter since 2015.**_ Why? First off, Miami continues to be a desirable city for those moving from high-tax states. Additionally, companies allowing employees to work remotely just made it easier for those who've always wanted to escape extremely cold winters or relocate to a city with a beach lifestyle. Secondly, Condo Blackbook's 3Q 2020 analysis shows that luxury condos in Miami are in high demand, particularly in Edgewater, which posted a 114% year-over-year growth in sales. Contrary to what most market experts had predicted about buyer focus shifting to single-family homes due to the pandemic, the high sales volume reported this quarter shows that Miami's luxury condos are in strong demand with buyers. Read on for more data about how prices, days on market and inventory trends have changed as the market is emerging from the effects of the pandemic in our full-length Q3 2020 Miami Luxury Condo Market Report below: _This luxury condo market report only features properties priced $1 million and above, and covers the neighborhoods of Greater Downtown Miami (inclusive of Edgewater and Brickell), Miami Beach (inclusive of Surfside, Bal Harbour, Sunny Isles Beach and Fisher Island) as well as Coral Gables and Coconut Grove._ ### Overall Miami Luxury Condo Market Summary - 3Q 2020 #### Quarterly sales up by 9.6% YoY #### Overall luxury condo price/sq. ft. increases by 3.3% YoY #### Inventory levels reduce, but buyers retain advantage **3Q 2020 Overall Miami Luxury Condo Market Highlights** * Edgewater leads Q3 sales growth with **114% year-over-year jump** * Mid/North Beach, Sunny Isles Beach, and Greater Downtown also report positive year-over-year sales * **12-month sales trendline positive**, shifting from negative in Q1 & Q2 to flat in Q3 2020 * Overall Prices Up - Median sales price up 9.6% and Price/sq. ft. by 3.3% year-over-year * South Beach is the most expensive neighborhood of Q3-20, posting a median price of $1,106/sq. Ft., beating Fisher Island from top spot last quarter * New construction buildings built 2015-2020 and 2000-2014 reported strongest sales growth * Sellers received maximum return on investment for condos in luxury buildings built 2015-2020 * Days on Market stable year-over-year * Inventory up year-over-year as expected, but 10% lower quarter-over-quarter, strongly hinting at a faster drop over next two quarters * 2020 continues as a buyer's market with signs of a quick bounceback from COVID-19 impacts ## Table of Contents 1. Overall Miami Luxury Condo Sales Trends 2. Miami Neighborhood Trends - Number of Sales 3. Overall Miami Luxury Condo Price Trends - Sales Price, Price/Square Foot 4. Miami Neighborhood Trends - Sales Price, Price/Square Foot 5. Overall Miami Luxury Condo Sales Price Trends by Building Year 6. Overall Miami Luxury Condo Days on Market Trends 7. Miami Neighborhood Trends - Days on Market 8. Overall Miami Luxury Condo Inventory Trends 9. Conclusion 10. Where does the Miami Luxury Condo Market go from Here? ## Luxury Condo Sales Up in Miami Overall **Overall Miami Luxury Condo Quarterly Market Summary - Fig. 1.1** **Quarters** **Number of Sales** **% change in Sales** **Median Sale Price** **% change in Median Sale Price** **Median Sp/Sqft** **% change in Median Sp/Sqft** **Median of DOM** Q3 2020 182 9.6% $1,805,000 9.6% $771 3.3% 158 Q3 2019 166 $1,646,500 $747 152 **Sales rebound to strongest Q3 since 2015.** Even with the pandemic unsettling market dynamics for the first half of the year, it's exciting to see Miami luxury condo sales make a strong comeback this quarter. Reporting a year-over-year increase of 9.6% against Q3 2019, sales are at their highest in a third-quarter since 2015 (Fig. 1.2). A closer look into the Monthly Sales Chart (Fig. 1.3) reveals that the market gathered more steam towards the tail-end of the quarter. While July started out slower with 55 sales compared to last year's 65, August picked up momentum with 57 sales compared to 2019's 45 sales, and **September posted an amazing 70 closed sales compared to last year's 56**. Now, even though part of these sales likely represent deals that were held back in Q2 due to the global lockdown (as predicted in our Condo Blackbook Q2 report here), there is ample momentum to conclude that the market is catching up and getting back on track. This remarkable progress can also be seen in the 12-month Sales Trendline (Fig. 1.4) that has finally corrected from a negative position (in the first and second quarters) to a flat line in Q3. Still, we will be keeping a close watch on the next quarter's performance, which is going to be critical to declare whether the Miami luxury condo market has made a full recovery from the pandemic-caused disruption or not. **Overall Miami Quarterly Luxury Condo Sales 2015 - 2020 - Fig. 1.2** **Overall Miami Monthly Luxury Condo Sales Jan. 2016 to Sep. 2020 - Fig. 1.3** **Overall Miami 12-Month Luxury Condo Sales with Trendline - Fig. 1.4** ## Miami Neighborhood Trends - YoY Number of Sales ### Q3 2020 Year-over-Year Sales Trends (Fig. 1.5) * **_Winner:_ Edgewater** reports the highest percentage (114%) growth in year-over-year sales -- an impressive yet expected feat, considering it was one of the few neighborhoods poised for an early recovery according to our Q2 report * _**Up:**_ **Mid/North Beach** (60%), Sunny Isles Beach (38%), and Greater Downtown Miami (21%) - all report an increase in their year-over-year sales * _**Flat:**_ The combined neighborhood of Surfside and Bal Harbour posts the same level of sales as Q3 2019 * _**Down:**_ **South Beach** (-36%), Brickell (-9%), Coconut Grove & Coral Gables (-8%), plus Fisher Island (-7%) -- all report a decline in their year-over-year sales _More details available, including quarterly data, in the dedicated reports for Greater Downtown Miami, Miami Beach and the Barrier Islands, plus Coral Gables & Coconut Grove._ **Miami Luxury Condo Neighborhood 3Q20-over-3Q19 Sales Comparison - Fig. 1.5** ## Overall Miami Luxury Condo Prices Up - Both Sales Price and Price/Sq. Ft. **Price/sq. ft. up 3.3% at $771, Median Price up 9.6% Year-over-Year.** The trend of higher year-over-year prices continues into the third quarter of 2020\. (Price per sq. ft. for the first two quarters was higher compared to the same quarters in 2019\. See Fig. 2.1 below). Overall, the Price per Sq. Ft. for luxury condos increased 3.3% from $747/sq. ft. in Q3 last year to $771/sq. ft. this year (Fig. 1.1). However, the peculiar peak (of a 10% quarter-to-quarter increase) seen in Q2, settles down this quarter. The Median Sales Price also increased (9.6%) from $1,646,500 in Q3 last year to $1,805,000 in Q3 this year. **Overall Miami Luxury Condo Quarterly Price per Sq. Ft. 2016-2020 - Fig. 2.1** ## 3Q 2020 Miami Neighborhood Trends - Price/Square Foot, Sales Price ### Q3 Year-over-Year Price Trends **Median Price per Sq. Ft. (Fig. 2.2.1)** * _**Winner:**_ **South Beach** is the most expensive neighborhood with a median price of $1,106/sq. ft., outperforming the second quarter's most expensive neighborhood of Fisher Island * _**Winner:**_ **Surfside & Bal Harbour** reports the **highest percentage growth** in year-over-year Price per sq. ft. (36%), continuing its winning streak from Q1 * _**Up:**_ Other neighborhoods posting an increase in year-over-year Price per sq. ft. include Edgewater (26%), Greater Downtown Miami (14%), Coconut Grove & Coral Gables (14%), Sunny Isles Beach (10%), and Brickell (6%) * _**Flat:**_ **South Beach** posts a negligible change in year-over-year Price per sq. ft. * _**Down:**_ Neighborhoods posting a decline in year-over-year Price per sq. ft. – Mid/North Beach (-5%) and Fisher Island (-32%) * _**Worth Noting:**_ It's quite an unusual quarter for Fisher Island, as prices rarely trend below the $1,000 mark in this exclusive neighborhood, which are now at $791/sq. ft. This can partly be explained by the fact that only low-range properties were sold during Q3, as can be seen below in Fig. 2.2.2. **Median Sales Price (Fig. 2.2.2)** * _**Winner:**_ **Edgewater** reports the highest percentage growth in year-over-year Median Sales Price (48%), replacing previous quarter's Fisher Island for the winner's tag * _**Winner:**_ The combined neighborhood of Surfside & Bal Harbour reports the **highest sales price** for the second consecutive quarter ($3 million in Q3) * _**Up:**_ Other neighborhoods reporting an increase in year-over-year Median Sales Price -- Surfside & Bal Harbour (43%), Sunny Isles Beach (27%), South Beach (8%), Brickell (5%), and Greater Downtown Miami (2%) * _**Down:**_ Neighborhoods reporting a decrease in year-over-year Median Sales Price – Fisher Island (-71%), Coconut Grove & Coral Gables (-16%), and Mid/North Beach (-4%) * _**Worth Noting:**_ Although Fisher Island perpetually has one of the highest-priced luxury condos in Miami, this quarter's fall to a median sales price of $2 million indicates that only bottom-range luxury condos were sold in the neighborhood **Miami Neighborhood 3Q20-over-3Q19 Median Price per Sq. Ft. Comparison - Fig. 2.2.1** **Miami Neighborhood 3Q20-over-3Q19 Median Sales Price Comparison - Fig. 2.2.2** ## 3Q 2020 Overall Miami Sales Price Trends by Building Year Below is a detailed analysis of how prices added up on the basis of age of construction for luxury condos in Miami, categorized as new construction buildings (2015-2020), buildings built from 2000-2014, and pre-2000 buildings. * New Construction Buildings post record-high sales, reporting more than double those of Q2 (23 sales versus 53) + increase in year-over-year value * Buildings Dated 2000-2014 showed strong sales growth, increasing 10% year-over-year + increase in year-over-year value * Condos Built before 2000 outperform sales in every third-quarter 2015-2018 + decrease in year-over-year price per sq. ft. ### New Construction Condos Built 2015-2020 Sales volumes are back up in Q3 for this newly built section. Posting a **record-high number of sales for a quarter** (in the entire period under review); this segment reports a 43% increase year-over-year and 130% increase over the previous quarter (Fig. 2.3). The Price per sq. ft. for this segment **increased 21% year-over-year**, while the trend remained flat quarter-over-quarter. At $948/sq. ft., the price trends in the mid-range of median prices traced over the past five years (Fig. 2.4). **Overall Miami Luxury Condo Sales for Buildings Dated 2015-2020 - Fig. 2.3** **Overall Price per Sq. Ft. for Buildings Dated 2015-2020 - Fig. 2.4** ### Condos Built 2000-2014 Again, after a short hiatus in Q2, **sales make a strong comeback** with an impressive 74% increase quarter-over-quarter and **10% increase** compared to the same quarter last year (Fig. 2.5). The **median price per sq. ft.** too posts a **7% increase year-over-year**, closing at $761/sq. ft. (Fig. 2.6), and showing good value for sellers. **Overall Miami Luxury Condo Sales for Buildings Dated 2000-2014 - Fig. 2.5** **Overall Miami Price per Sq. Ft. for Buildings Dated 2000-2014 - Fig. 2.6** ### Condos Built Before 2000 For Miami's older luxury buildings, **sales declined 15% year-over-year**. However, they were up 44% quarter-over-quarter and outperformed the sales reported in the third quarter for years 2015-2018 (Fig. 3.8). On the other hand, the median **Price per sq. ft.** in this seasoned segment was **down 16% year-over-year** and 7% quarter-over-quarter at $636/sq. ft., showing a good window of opportunity for buyers. **Overall Miami Luxury Condo Sales for Buildings Dated 1921-1999 - Fig. 2.7** **Overall Miami Price per Sq. Ft. for Buildings Dated 1921-1999 - Fig. 2.8** ## Overall Miami Luxury Condos Days on Market Up QoQ, Flat YoY **Days on Market increase 46% quarter-over-quarter.** With the pandemic-related lockdowns delaying plenty of deals, it is quite expected for the days on market to climb when sales for such properties finally close. This, most likely, is what has increased the days on market for luxury condos by 46% between Q2 and Q3. Luxury condos spent 50 more days on market in Q3, when compared to Q2, and 6 more days compared to the same quarter last year (Fig. 3.1). What's worth noting is that while the sudden spike in quarter-to-quarter days on market could be attributed to the pandemic, the metric is stable year-over-year, showing that buyers-seller communication is not worse off a year forward. **Overall Miami Luxury Condos Quarterly Days on Market 2018 - 2020 - Fig. 3.1** ## Miami Neighborhood Trends - Days on Market ### Q3 2020 Year-over-Year Days on Market Trends (Fig. 3.2) * _**Winner:**_ **Edgewater** posts the greatest decline of 54 days for Median Days on Market, while Fisher Island reports the highest increase of 98 days in its Median Days on Market * A majority of the neighborhoods post a decline in their Median Days on Market for luxury condos -- Edgewater (-31%), Greater Downtown Miami (-24%), Brickell (-15%), Mid/North Beach (-9%), plus Surfside and Bal Harbour (-2%) * Neighborhoods reporting an increase in their Median Days on Market, besides Fisher Island (79%), include South Beach (13%), Sunny Isles Beach (5%), plus Coconut Grove & Coral Gables (2%) **Miami Neighborhood 3Q20-Over-3Q19 Days on Market Comparison - Fig. 3.2** ## Luxury Condo Inventory Down QoQ Expectedly, Market Stays Buyer-friendly **Q3 2020 closes with 51 months of inventory.** As the Miami luxury condo market shows signs of a recovery, the months of inventory also began to normalize after peaking in Q2 2020\. New deals plus closings from the previous months (stalled only due to the pandemic) give ample momentum to bring the trend down by 10% quarter-over-quarter. However, closing Q3 at 51 months, inventory is 38% higher year-over-year and still a long way off from reaching its ideal of 9-12 months. This is to be expected, since inventory calculations are based on the last 6 month price trends and Q2's progress was interrupted by the pandemic. We almost certainly will see inventory levels drop in Q4 and again in Q1 2021\. In the meantime, buyers still have the upper hand in negotiations and have an extended period to find the best deals possible. Search here for luxury condos for sale in Miami. **Overall Miami Months of Luxury Condo Inventory from Mar. 2019 to Sep. 2020 - Fig. 4.1** A balanced market has only 9-12 months of inventory. The months of inventory are calculated as the number of active listings + number of pending listings divided by the average number of deals in the last 6 months. ## Conclusion **Miami luxury condo market shows signs of recovery, though current trends still favor buyers.** It is refreshing to see the market start gain strength this quarter, as Q2 absorbed the most of the negative impact from the pandemic. Overall Miami luxury condo sales in Q3 2020 improved strongly year-over-year. Coupling this with the positive indication from the 12-month sales trendline (which flattened after two consecutive quarters of a negative trend), plus the high demand we currently see in the market, it's easy to say that we are in a surprisingly early market recovery bounce, which most likely will carry into Q4 2020 and Q1 2021. As predicted in our Q2 Miami Luxury Condo Report, _**Edgewater**_ has made an early, and astounding recovery, posting the highest year-over-year growth in sales for all the neighborhoods in our report. Additionally, _**Mid/North Beach**_, _**Sunny Isles Beach**_, plus _**Greater Downtown Miami**_ posted a complete turnarounds from their negative numbers in the previous quarter to higher year-over-year sales this Q3. Both the Sales Price and Price per sq. ft. also posted year-over-year gains, reflecting that sellers are getting good returns for their luxury condo investments in Miami. Properties in the combined Surfside and Bal Harbour neighborhood posted maximum gains in year-over-year value, followed by Edgewater, Greater Downtown Miami plus Coconut Grove & Coral Gables. While overall inventory was expectedly up, simply because the trend considers average activity in the past 6 months, we strongly expect levels to go down over the next two quarters, at least. However, for now, buyers have the advantage of extended time and options, until inventory bounces back to pre-COVID levels and lower, which they can use to their advantage as they look for luxury condos for sale in Miami. ## Luxury Market Predictions and Analysis: Where Does the Market Go From Here? With only one quarter left until the end of 2020, expecting a reversal in the current buyer-friendly cycle is unlikely. However, if the market maintains its pace next quarter, which it most likely will, we can reasonably expect trends to normalize to pre-COVID levels relatively soon. Additionally, the following factors will influence Miami's luxury condo market over the remainder of the year: **COVID-19 after-effect -- Miami a stronger favorite.** While the pandemic may have stalled buyer plans in Q2, the third quarter saw all of that pent-up demand come through. We are also seeing increased demand from: * Those from high-tax states, as Miami's no-income-tax environment is a welcome financial relief, particularly when other aspects of the economy are unpredictable * Those looking to escape the extremely cold winters up north and migrate to the warmer, balmier winters of Florida * Those working from home, who now have the flexibility to work from anywhere such as a sugar-sand beach, a vibrant tropical garden, or a sunny den with ocean views * Those seeking more cultural diversity and a city with peaceful #BLM protests * Those who were simply waiting for travel restrictions to be eased **Presidential Elections.** The 2020 Presidential election still remains a wild card as we get closer to election day. Historically, Presidential elections have always put a pause on real estate transactions. However, what remains to be seen is how much of an impact will that pause have on sales and inventory. **Inventory Correction.** Even as the buyer's market cycle has been extended naturally (due to COVID-19), we expect to see a correction soon. With high luxury condo demand and fewer pre-construction deliveries in the new future, inventory will continue coming down over Q4 2020 and Q1 2021 - offering a very positive outlook for the market in Miami. --- If you'd like more details on the data in our exclusive Condo Blackbook quarterly luxury condo market reports, please send us an email or give us a call anytime. Love what you see? Share our blog and subscribe (see the subscribe link on the top menu) to receive the latest Miami real estate market and lifestyle news in your inbox. Also, keep up with us on your favorite social media outlets. We're on Instagram, Facebook and Twitter!