
900 Biscayne Bay


900 Biscayne Blvd, Miami, FL 33132


About
900 Biscayne Bay
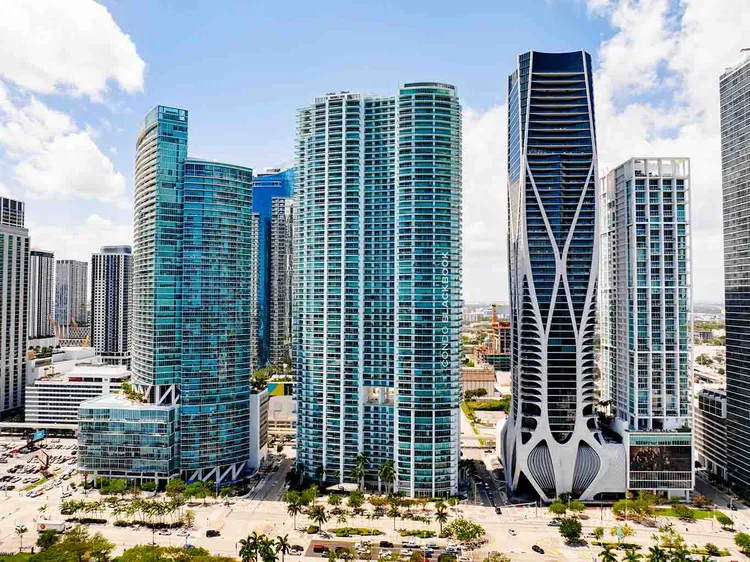
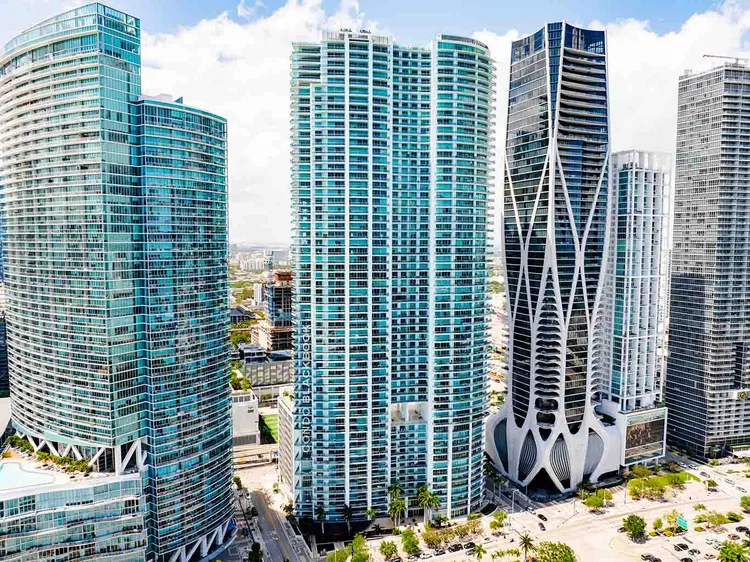
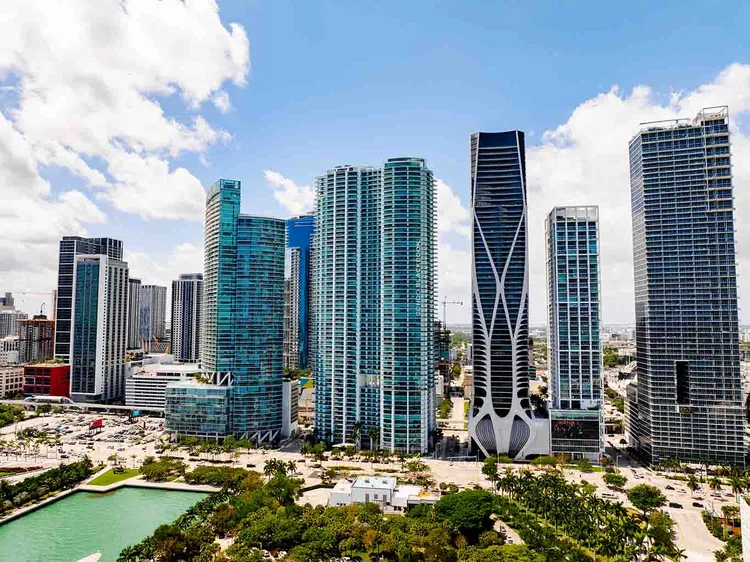
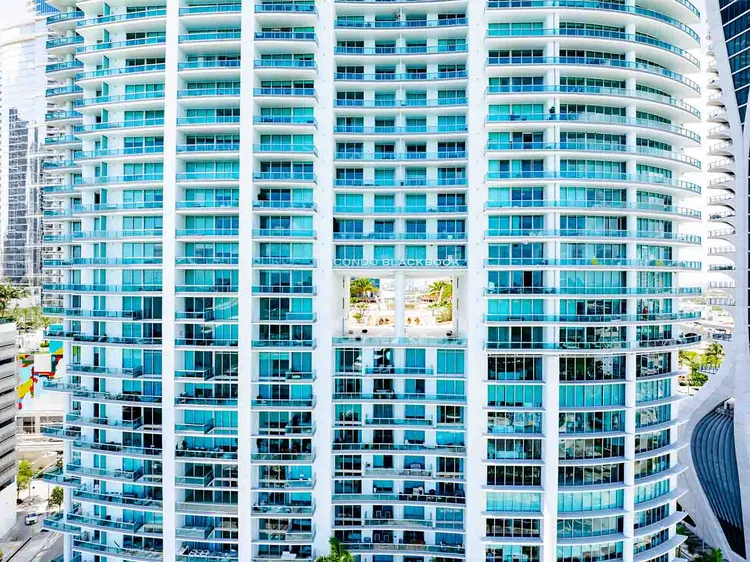
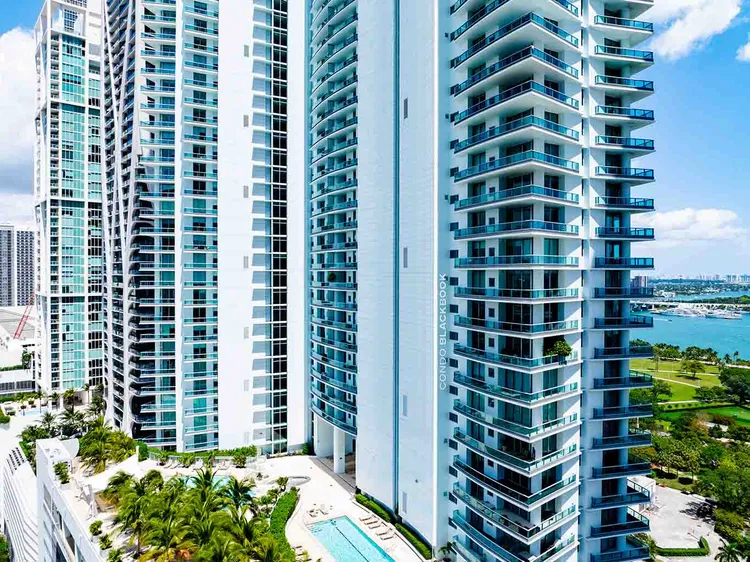
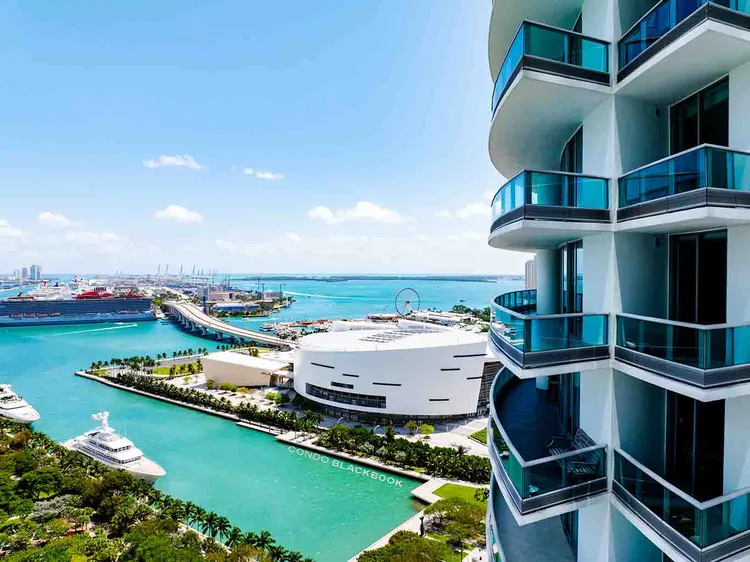
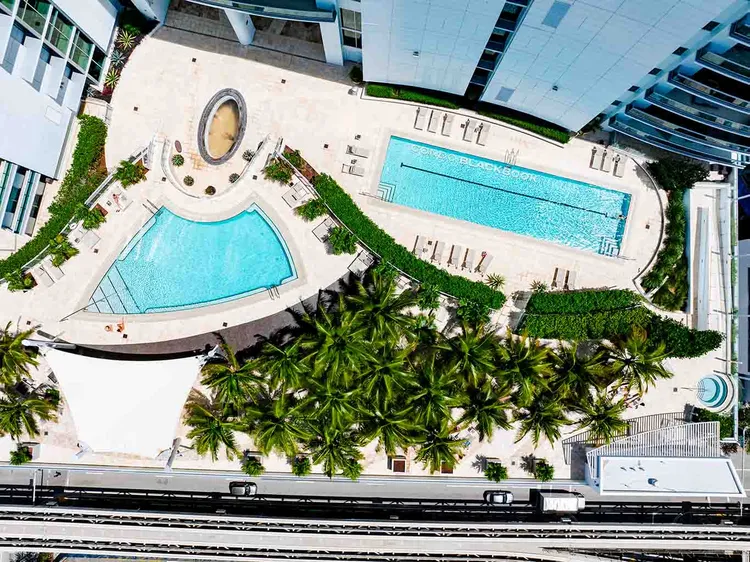
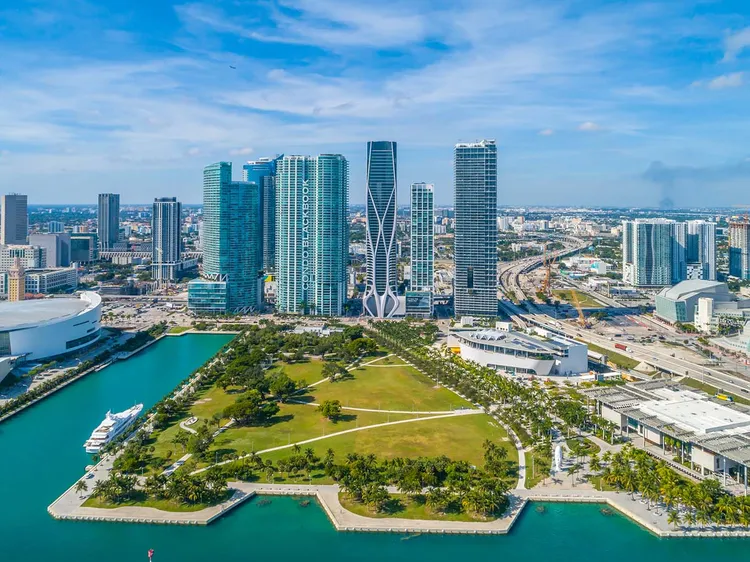
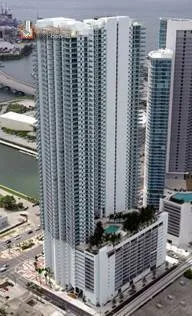
900 Biscayne: Spanning 63 stories, 900 Biscayne is one of the tallest residential buildings in the city. Located in Downtown Miami and packed with amenities.
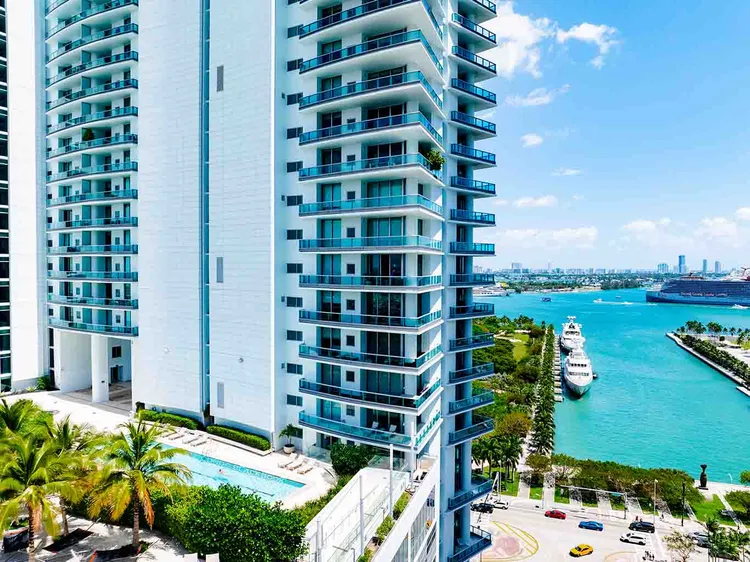
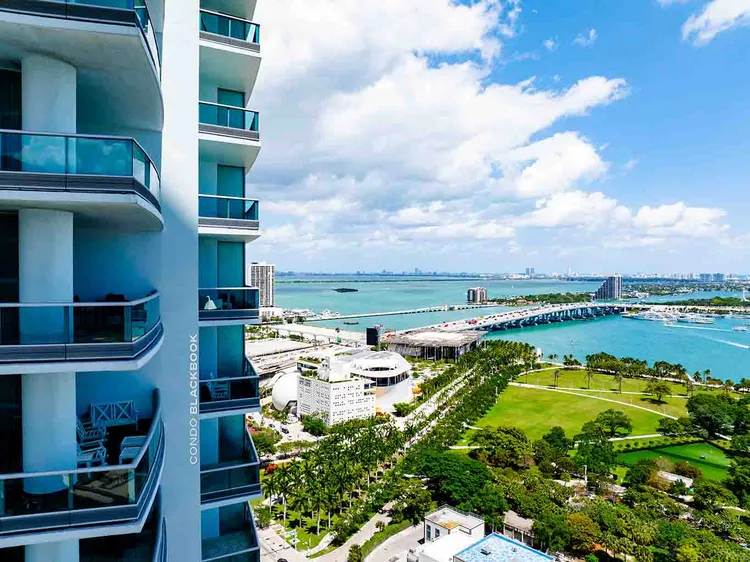
Thanks to its impressive height and enviable location, 900 Biscayne benefits from brilliant panoramic views of Miami Beach and Biscayne Bay across all of it’s 63 stories.
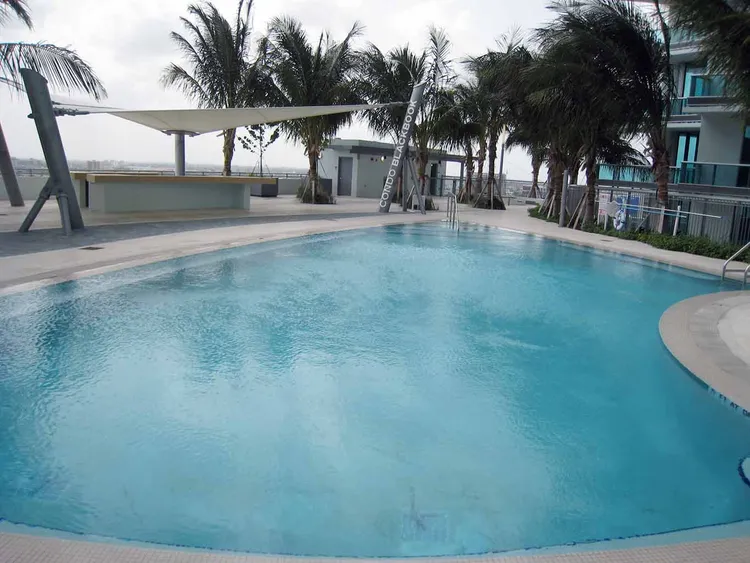
900 Biscayne was completed in 2008 and developed by the Terra Group; it is equipped with a long list of 5-star amenities and has luxury embedded in the design. The interesting architectural design was done by award-winning firm Revuelta Vega Leon. The architecture complements the amenities and interior-design brilliantly. With open flowing spaces and wide bending pools. The interior team was led by the incredibly talented Sam Robin.
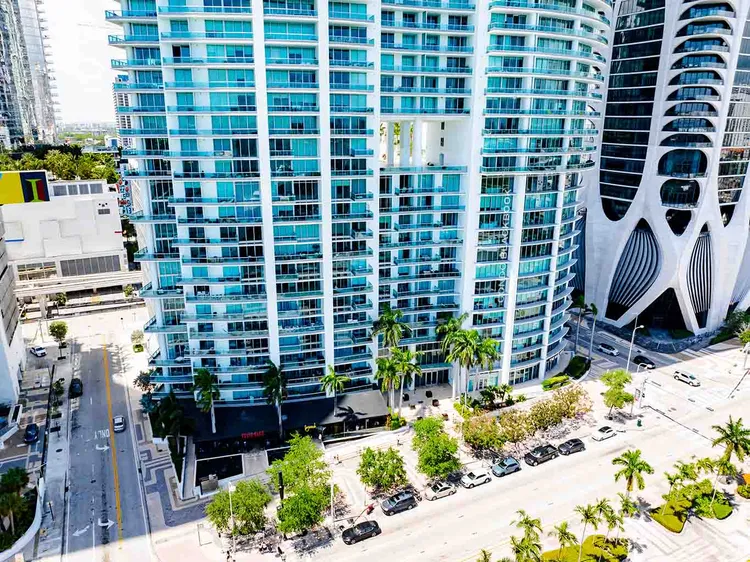
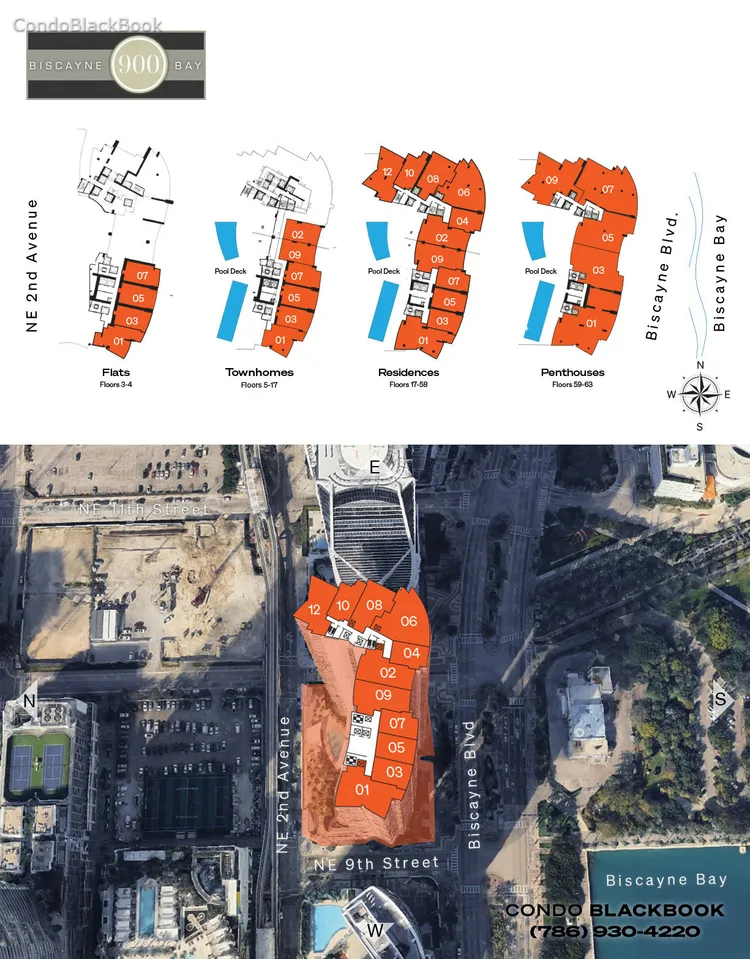
One of the main highlights of 900 Biscayne are the communal terraces located on various floors, the terraces provide an opportunity to socialise in a discerning setting with brilliant, unobstructed views. 900 Biscayne is made up of 509 residential units with everything from 1 bedroom apartments through to penthouse residences.
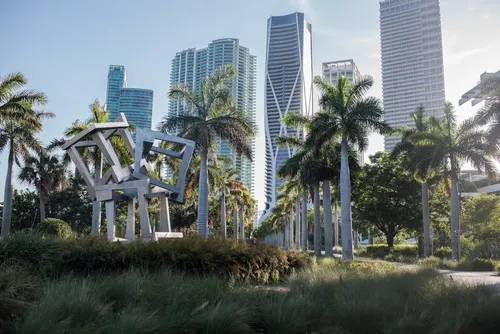
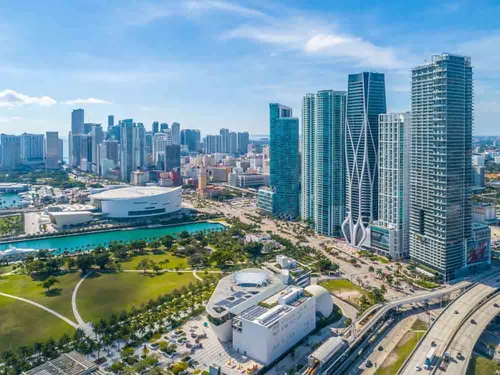
900 Biscayne’s optimal location also means that there is plenty within walking distance. The Miami Worldcenter is positioned across the street - The commercial center will offer an array of entertainment options from restaurants to retail, not to mention office space. There is also the Museum Park across the street, including Perez Art Museum (PAMM), the Frost Science Museum, the Adrienne Arsht Center for the Performing Arts, as well as the American Airlines arena all within a 10 minute walk. 900 Biscyane’s location means you are also within 10 minutes of Miami Airport. You can also commute to Brickell and South Beach in 5 minutes and 7 minutes, respectively.
900 Biscayne Building Amenities:
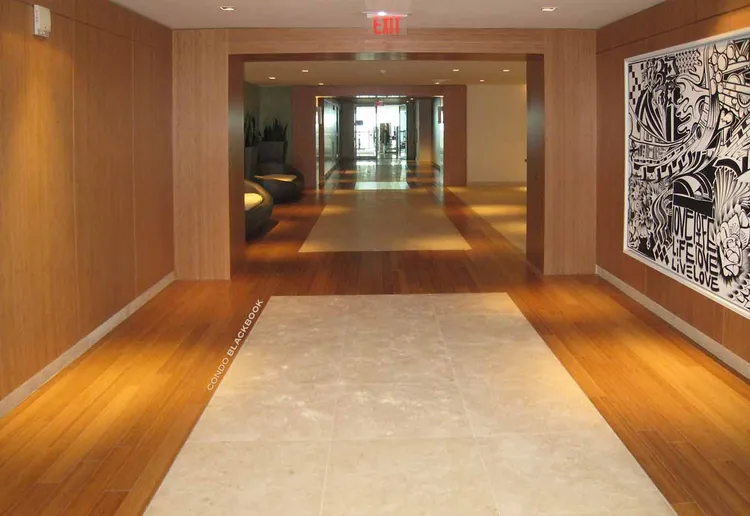
- 24-hour full-service concierge
- 24-hour security
- 24-hour valet parking
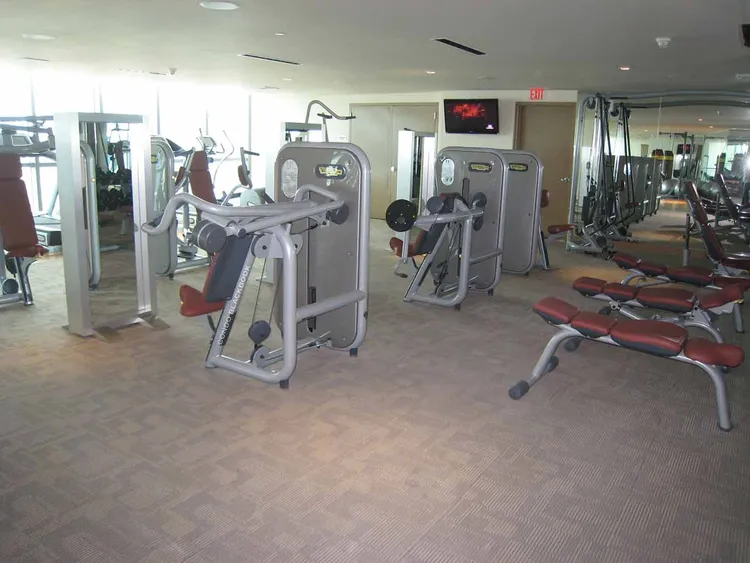
- State-of-the-art fitness center
- Full-service spa
- Spin room
- Sauna and steam rooms
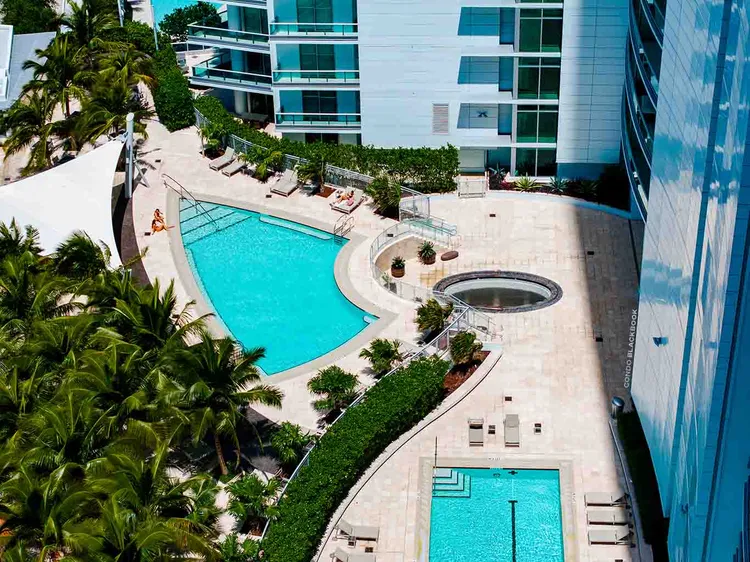
- Whirlpool hot tubs
- Theater room with 153-inch screen and seating for 35 people
- Children’s Room
- Business Center with private offices and conference rooms
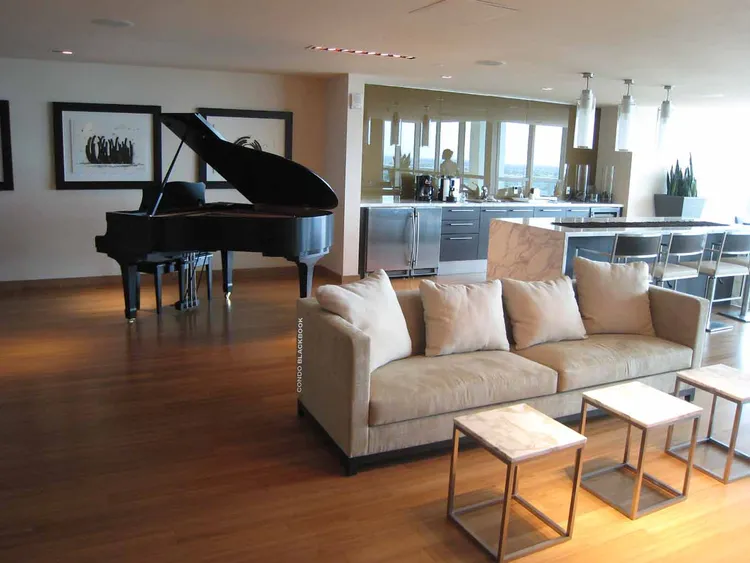
- Club room with piano, kitchen, billiards table, and conference table
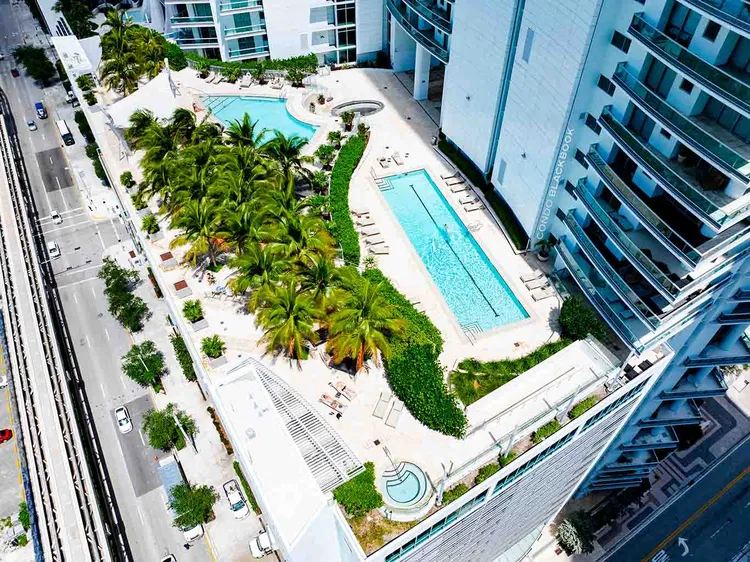
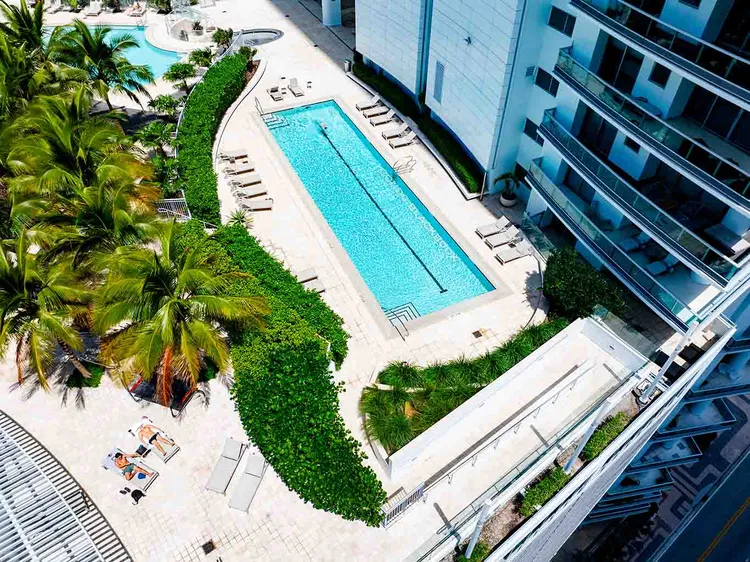
- Lap and resort-style pools
- Fire pit
- On-site building management
- Wi-Fi Internet available in lobby and amenity levels
900 Biscayne Residential Features:
- Tinted Sliding Impact Glass Doors and Windows
- Floor-to-ceiling Windows
- Spacious Walk-in Closets
- European-style Kitchens with Stone Countertops
- Miele Appliances
- Washer and Dryer
- Stone Master Baths
- Private Terraces
Building key details


Do you own in 900 Biscayne Bay?
Our condo sales experts and premier marketing team can help you sell your place for top dollar.

Building Amenities


Additional details
900 Biscayne Bay floorplans
900 Biscayne Bay building stats

900 Biscayne Bay building stats
Sales stats
Key averages for the building
$1,274,100
$844
$733,000*
*past six months
$650*
*past six months
53*
Avg Days on Market
*past six months
Sales history
Number of sold condos by month
Request info
Real Estate News
Preconstruction
900 Biscayne Bay
Downtown Miami
Alleged Negligence Cause of Lawsuit against 900 Biscayne Builder
A relatively new addition to Downtown Miami’s Biscayne Wall, the $175,000,000 skyscraper at 900 Biscayne Bay is at the center of a lawsuit between the owner of the structure, 900 Biscayne LLC, and the company responsible for its construction, Pavarini Construction. The construction company is in hot water over allegations that it failed to repair significant construction defects, namely in the garage waterproofing and rooftop A/C units. By ignoring requests to fix the flaws, Pavarini is accused of breaching the construction contract put in force at the start of construction in 2005. Though the damages being sought by 900 Biscayne LLC are unspecified, the suit was filed in Florida State Court and includes a strongly worded accusation against the builder: “900 Biscayne has been damaged by the failure of Pavarini to correct all of the defects with the project in accordance with its obligations under the construction contract.” The suit goes beyond the sole claim of breach of contract, pushing for further damages due to the violation of building codes. Pavarini has offered no statement regarding the suit at this time. 900 Biscayne is the fourth tallest building in Florida and is the second tallest residential building in the state. The tower reaches a height of 650 feet and contains 63 floors of residential housing units. Initially designed to rise to 712 feet, and contain 65 floors, 900 Biscayne instead received a decorative spire on its rooftop. Condos and two-level townhouses and penthouses present in the tower range in price from about $500,000 to over $3,000,000.
Real Estate News
Neighborhood Comparisons
Downtown Miami
Edgewater
Edgewater vs Downtown Miami: Which Miami Neighborhood Is Right for You?
Few Miami neighborhoods have evolved as distinctively as Downtown and Edgewater in recent years. Once quieter residential pockets, they have transformed into two of Miami’s most sought-after addresses, offering new levels of luxury living, culture, and waterfront access just minutes apart. Downtown is pulsing with momentum, where soaring new residential towers, landmark institutions like the Pérez Art Museum Miami (PAMM) and Frost Science Museum, and waterfront parks such as Bayfront Park shape the city's most cosmopolitan urban core. Edgewater is an elegant bayfront enclave offering sleek, design-forward high-rises, spectacular water views, and a more serene pace, all within easy reach of the action. The two neighborhoods offer prime locations, water views, lifestyle perks and a wave of exciting new developments. So which is better, Edgewater or Downtown Miami? Here’s our insider take to help you decide which of these two top Miami neighborhoods matches your lifestyle better. ## — The Lifestyle Edgewater, Miami’s evolution into a premier bayfront enclave with almost a cult following has taken a refined and curated approach: rather than bursting with nightlife or excessive retail, it has risen gracefully, growing taller and more boutique. Meanwhile, Downtown has undergone a remarkable transformation from a primarily nine-to-five business hub to a thriving, around-the-clock destination for luxury living, global finance and exciting retail, dining and entertainment. Edgewater is a true waterfront neighborhood: family-friendly, residential and perched directly on Biscayne Bay. Its prized green space is Margaret Pace Park, an 8-acre bayfront oasis with panoramic views. These are some of the reasons that make Edgewater the ultimate choice for families living in Miami. Set on the eastern side of Biscayne Boulevard, it also sees much less tourism while offering effortless access to everything that makes Miami exceptional, from the cultural energy of Downtown to the sun-soaked shores of South Beach. Plus, Wynwood, the Design District and Brickell are all within easy reach. In comparison, those craving a more urban feel may find Downtown Miami more compelling, as it puts you right in the thick of things, including a slew of trendy restaurants, shops, and the city’s museums. The neighborhood also offers excellent connectivity, with many transportation options. (To be fair, living on the south end of Edgewater also makes these arts and culture destinations within walking distance or one or two stops on the Metromover.) Downtown is rapidly becoming a more accessible and future-ready area. Watch our exclusive interview with Miami DDA’s CEO, Christina Crespi, to gain insights on all the behind-the-scenes action that’s making Downtown the most thrilling live-work-play-invest destination in Miami. ## — Getting Around ###### MiamiCentral - Brightline stop While Edgewater is tucked away on the eastern side of Biscayne Boulevard, it’s still close enough to walk or bike to many of Miami’s most desirable locations, such as the Perez Art and Frost Science Museums, Bayfront Park, the Kaseya Center (formerly American Airlines Arena), and is just a short Uber ride away from the Wynwood Arts District, Midtown and the Design District. Edgewater is also very close to the Omni Metromover stop on 15th Street in the Arts & Entertainment District on and has many free Miami trolley routes. But if you prefer a totally car-free lifestyle, Downtown is hard to beat. It is home to the MiamiCentral station, a key transportation hub where the Brightline, Metrorail, and Metromover converge, taking you to several top destinations including the airport. Miami's Tri-Rail commuter rounds out these options so that you can easily access many of Miami's top neighborhoods, the Tri-County area, like Fort Lauderdale and Palm Beach, and eventually all the way to Orlando. One of the greatest advantages of living in Downtown Miami is its walkability and urban neighborhood flavor. Both neighborhoods are considered a walker’s paradise, with walkscores of 91 for Downtown and an even higher 95 for Edgewater, Miami. Exploring a vehicle-free lifestyle in Miami? We break down the top Miami neighborhoods where you can live without a car. ## — The Work-Life Balance Edgewater is essentially a residential district, while Downtown is becoming one of Miami’s commercial hubs, home to many corporate headquarters, as well as Miami’s Government Center, courthouses, libraries and a Miami Dade Community College Campus. Its proximity to Brickell also makes Downtown a smart choice for professionals, potentially cutting down commute times if you’re working in the financial district. If living close to work is a top priority for you, Downtown might be a better bet; but if you prefer the idea of leaving the buzzing financial district behind and escaping to a quieter waterfront enclave only 10 minutes away, Edgewater may well provide that perfect balance. ## — Outdoor Living & Waterfronts When it comes to parks and greenspace, Edgewater has the edge: the entire neighborhood is centered around the lush and lively Margaret Pace Park. A favorite among families with children, fitness enthusiasts and dog lovers, the park provides two dog parks, basketball, volleyball and tennis courts, a scenic walking path, and direct access to the Bay for kayaking and paddleboarding. There's also a private marina next to the park. Downtown Miami, by comparison, is larger and home to two major parks: Bayfront Park, which has Bayside Marketplace, an amphitheater, and the Miami Skyviews Ferris Wheel; and Museum Park (also known as Maurice Ferre Park), situated next to Perez Art Museum Miami (PAMM) and the Frost Science Museum. Both are spacious, waterfront, and host regular community events, from yoga and fitness expos to concerts (including the Ultra EDM music festival) and marathons. The key difference is in the vibe: Margaret Pace Park feels like a true community space, steps from most Edgewater residences, with a tranquil pace amplified by direct waterfront views. Living here, you’ll surely see familiar faces here, neighbors and families. The park and bay views from Edgewater condo buildings are also incomparable. Downtown Miami’s parks are frequented by more tourists and visitors, and typically require a longer walk to get to unless you are living on Biscayne Boulevard. ## — Arts & Culture ###### by Robin Hill for Knight Foundation Downtown Miami holds within it the Downtown Arts District, or the Arts & Entertainment District, and is host to many cultural venues, such as the aforementioned Adrienne Arsht Center, the Ziff Opera House, the Perez Art Museum (PAMM), the Frost Science Museum and the Kaseya Center (where the Miami Heat play and major concerts happen), as well as a few alternative art spaces and galleries. In this sense, Downtown Miami takes the lead for art and cultural offerings. However, Edgewater makes up for this with its prime location and easy access to some of Miami’s best cultural destinations. Just a short drive away is the vibrant Wynwood Arts District, with not only its world-famous Wynwood Walls but some of the city’s best galleries as well, including The Margulies Collection. Additionally, the historic Design District also features the Miami Institute of Contemporary Art, and several ongoing art installations and exhibitions. Edgewater's proximity to fair sites during the annual Miami Art Week—including Art Miami—also make it the ideal location to be, and the nearby Moore Building and Institute of Contemporary Art (ICA) in the Design District make it more competitive with Downtown Miami when it comes to cultural access. Use our specialized search engine to discover the best condo and rental options in Edgewater and Downtown Miami. ## — Signature Flavors ###### by KLAW MIA Because Downtown Miami is a larger and busier neighborhood that caters to a bustling business lunch crowd, it naturally has a wider variety of eateries, making it a foodie’s paradise. Miami's urban core is filled with amazing dining options, including the many eateries located at Central Fare, the food hall at MiamiCentral, which serves everything from American comfort food to exotic international flavors. Another favorite food hall in Downtown is Julia & Henry’s on historic Flagler Street. Other popular spots in Downtown include CVI.CHE 105, known for its Japanese-Peruvian fare; Fratelli Milano, a standout for authentic Italian; and the Michelin-rated NIU Kitchen, for authentic Spanish cuisine. Fine dining options also are plentiful in Downtown Miami, with renowned spots like Zuma for Japanese-inspired dishes and Il Gabbiano for superb Italian. Not to be left out, living in Edgewater definitely offers you great dining options. Mignonette, for example, is famous for serving some of the best seafood and oysters around in a 1930s architectural gem; Amara at Paraiso offers a refined waterfront experience, and Klaw Miami delivers exceptional seafood in an iconic, historic setting. Paolo Fontanot’s authentic Italian bakery and cafe is a must-visit, being the only U.S. location outside of Italy. ## — The Shopping Edit ###### Brickell City Centre Living in either neighborhood also means you'll likely venture out to Wynwood and the Design District for even more world-class food options. If retail therapy is your thing, both Downtown Miami and Edgewater offer compelling options, each with its own character. Downtown Miami has a slight advantage, given that Brickell City Centre is just over the Miami River south of Downtown, offering international designer brands and a mix of fashion, tech and beauty stores, all anchored by a Saks Fifth Avenue. In the immediate neighborhood, you can stroll the shops at Bayside Marketplace, and find burgeoning boutiques in the historic—and under renovation—Flagler Street, home to art galleries and the oldest perfumery in Florida. For groceries, Whole Foods and Publix are your main stores. Comparatively, Edgewater provides easy access to the many unique shops and boutiques in Wynwood, Midtown and the Design District, where you can purchase anything from wearable art and collectables to designer kitchen and bath fixtures. Publix is your nearest grocery store, and a Whole Foods is set to open soon on Biscayne Boulevard. And you have a Target and Trader Joe’s in Midtown. ## — Architecture & Design Downtown Miami is one of the oldest areas of the city, with many pre-war buildings typical of large urban centers. Mixed in with some of the most beautiful architecture and historic landmarks, you'll find new modern high-rises, as well as a few lofts, both new and converted. Edgewater is a more newly developed area, with many luxury highrises, but retains some of its 1940s charm with scatterings of Florida-style bungalows, and a few historic buildings. The condo options in Edgewater will also offer you state-of-the art amenities, including spas, gyms, meditation areas, and sunrise and sunset pools. Downtown Miami’s Aston Martin Residences is one of the condos that are redefining luxury living through its extensive amenity offerings, such as an art gallery, full-service spa, virtual golf, infinity edge pool, rooftop helipad and super yacht marina. It’s also home to some of the city’s most iconic architectural landmarks, including the Herzog & de Meuron-designed PAMM and the last building designed by the late Zaha Hadid, the uber luxurious One Thousand Museum. Paramount Miami Worldcenter is another complex of buildings in the Entertainment District of Downtown that’s catering to lifestyle amenities. This development offers residents a sporting complex, including running tracks, a soccer field, boxing studio, multiple pool and yoga decks, as well as music recording studios, meditation centers, spas and beauty salons, and along with the Legacy Hotel and Residences, a state-of-the-art wellness center and clinic. In Edgewater, Elysee Miami delivers a health club with a resort-style lap pool, a spa, a blow dry bar, a yoga studio and a waterfront fitness center. The 30th-floor sky lounge is home to a grand salon with 360-degree views, a grand dining room with a wine cellar, a library, a private theater, a chef-grade commercial kitchen, and a teen lounge. Contact us for more customized condo suggestions in either neighborhood, or use our personalized condo search tool. ## — Prices & Perspective Both Edgewater and Downtown Miami boast beautiful new high-rise condo options, with varying prices per square foot. Both neighborhoods have seen their prices increase of the last year, offering a good investment as well. As of the date of this posting, the average price per square foot in Edgewater is around $340 and residential units lists for an average price of $800,000, but can go up to tens of millions for penthouse units in the top buildings, like Elysee and Missoni Baia. In Downtown Miami, the median listing per square foot is about $489, and the average listing price for a condo is about $750,000\. Penthouses in Aston Martin Residences or One Thousand Museum will be about $30,000,000 up to $60,000,000. If you are considering renting before buying in either neighborhood, you can also find excellent apartments or condos for rent in both Edgewater and Downtown Miami. ## — Edgewater vs Downtown Miami: Which Neighborhood is Better? If you’re looking for a quiet waterfront living experience with minimal traffic, abundant greenspace, and little to no tourism, where you can enjoy the outdoors and the comfort of seeing your neighbors’ familiar faces each day, Edgewater may be the perfect fit. If, however, you still have a wild streak and want more of an urban feel, enjoy eclectic dining, mingling with visitors from around the world, and prefer a car-free lifestyle, or are looking for a part-time or investment property, Downtown Miami could be your ideal location. If you’re interested in more neighborhood comparisons, explore one of our expert Miami neighborhood guides below: * Edgewater vs South Beach * South Beach vs Miami Beach * The Miami Beaches: South vs Mid-Beach vs North Beach * Brickell vs South Beach * Brickell vs Brickell Key * Miami Beach vs Fort Lauderdale Need help choosing the perfect Miami neighborhood? Speak with our local real estate experts today. Whether you're relocating, investing, or looking for a second home, we'll guide you to the right area—and the perfect property. Just call, text or email us now.
Market Reports
Quarterly Reports
Stats & Reports
Downtown Miami
Greater Downtown Miami Luxury Condo Market Report Q1 2025: Strong Prices, Surging Inventory
With Q1 2025 numbers in, our in-depth analysis reveals that Greater Downtown Miami's luxury condo market opened the year on a stable note. Momentum remained steady and prices reported modest single-digit gains for sellers. However, with inventory levels trending higher than in recent quarters and luxury condos taking slightly longer to sell, the influence of a buyer's market became increasingly evident across this urban core area. In Q1 2025, Brickell stood out as the best-performing submarket in Greater Downtown Miami. The financial district led both price gains and year-over-year sales growth, while also recording the fastest days on market and the lowest levels of inventory. With seamless public transit access, high walkability, a dynamic urban lifestyle and a growing mix of high-end residences, it's no surprise that Miami's "Manhattan of the South" continues to capture the attention of end-users and investors alike. It's also home to some of Miami's most anticipated pre-construction condos, such as Cipriani Residences Miami, Baccarat Residences, and The St. Regis Residences, reinforcing its position as a premier destination for luxury living. Read below for our exclusive and comprehensive analysis of how Greater Downtown, Edgewater, Brickell, and Downtown Miami performed in Q1 2025, along with a detailed comparison to the overall Miami luxury condo market trends in terms of sales, prices, days on market, and inventory. **Greater Downtown Miami Luxury Condo Market at a Glance: Q1 2025 YoY Closed Sales** **Greater Downtown Miami Luxury Condo Market at a Glance: Q1 2025 YoY Median Sale Price** **Greater Downtown Miami Luxury Condo Market at a Glance: Q1 2025 YoY Median Price/Sq. Ft.** ### Summary of Q1 2025 for the Greater Downtown Miami area: * **Brickell** had the **highest sales volume** (57 sales) * **Brickell** also reported the **highest percentage YoY sales growth** (10%) * **Edgewater** posted the **highest median sale price** ($1.54 million) * **Edgewater** registered the **highest price per square foot** ($961) _For this report, we've included the zipcodes 33129, 33130, 33131, 33132, 33137 – Brickell Hammock, Brickell, Brickell Key, Downtown Miami, Arts & Entertainment District, Edgewater, Wynwood, Midtown and the Design District. This luxury condo market report focuses exclusively on properties priced $1 million and above, and generally does not include pre-construction condo sales._ **Q1 2025 Greater Downtown Miami Luxury Condo Market Highlights** * **Sales** remained flat year-over-year. * **12-month sales** trendline downshifted to a negative trajectory from a positive curve in Q4 2024. * **Price per Square Foot** went up 5% year-over-year to $925. * **Median Sale Price** remained flat year-over-year at $1.4M. * **Days on Market** remained flat year-over-year at 80 days. * **Inventory** went up to 26 months. * Greater Downtown closed Q1 2025 as a **buyer's market**, mirroring the overall Miami market. **Q1 2025 Greater Downtown Sub-Neighborhood Highlights** * **Brickell** emerged as the **strongest market** of Q1 2025 in Greater Downtown, leading year-over-year sales growth with a 10% increase. * 12-month sales trendline negative across the board. * Luxury condos in **Brickell** provided the **best value to sellers** in Greater Downtown, with the highest percentage gains (7%) in year-over-year Price per Square Foot. * **Edgewater** held its position as the most expensive neighborhood in Greater Downtown, recording a median price of $961/Square Foot. * **Edgewater** reported the **highest Median Sale Price** in Greater Downtown at $1.54 million. * **Brickell** emerged as the **fastest-selling market** of Greater Downtown, as luxury condos took only 67 days to sell. * **Edgewater and Brickell** posted the **lowest levels of inventory** in the Greater Downtown area. ## Table of Contents 1. Greater Downtown Miami Luxury Condo Sales Trends 2. Greater Downtown Miami Luxury Condo Price Trends 3. Greater Downtown Miami Luxury Condo Days on Market Trends 4. Greater Downtown Miami Luxury Condo Inventory Trends 5. Edgewater Neighborhood Trends - Overall Sales 6. Edgewater Neighborhood Trends - Sales Price, Price/Square Foot 7. Edgewater Neighborhood Trends - Days on Market 8. Edgewater Neighborhood Trends - Inventory 9. Brickell Neighborhood Trends - Overall Sales 10. Brickell Neighborhood Trends - Sales Price, Price/Square Foot 11. Brickell Neighborhood Trends - Days on Market 12. Brickell Neighborhood Trends - Inventory 13. Downtown Neighborhood Trends - Overall Sales 14. Downtown Neighborhood Trends - Sales Price, Price/Square Foot 15. Downtown Neighborhood Trends - Days on Market 16. Downtown Neighborhood Trends - Inventory 17. Conclusion --- **Q1 2025 Greater Downtown Miami Luxury Condo Market Summary - Fig. 1** **Quarter** **Closed Sales** **% Change in Sales** **Median Sale Price** **% Change in Median Sale Price** **Median Price/Sq. Ft.** **% Change in Median Price/Sq. Ft.** **Median DOM** **Q1 2025** 92 \-21.4% $1,430,000 2.1% $925 1.4% 80 **Q4 2024** 117 $1,400,000 $912 67 **Q1 2025 Greater Downtown Miami Luxury Condo Market Summary - Fig. 1.1** **Quarter** **Closed Sales** **% Change in Sales** **Median Sale Price** **% Change in Median Sale Price** **Median Price/Sq. Ft.** **% Change in Median Price/Sq. Ft.** **Median DOM** **Q1 2025** 92 \-2.1% $1,430,000 0.2% $925 5% 80 **Q1 2024** 94 $1,426,995 $881 78 1\. Q1 2025 Greater Downtown Miami Luxury Condo Sales: Flat YoY ### Sales flat-negative year-over-year; 12-month sales trendline negative Deviating from Miami's overall flat-positive quarter-over-quarter and year-over-year performance, luxury condos in the Greater Downtown area recorded comparatively slower activity than the better-performing submarkets of Miami Beach (collectively), and Coconut Grove & Coral Gables (combined) this first quarter. Below are the Key Q1 2025 Sales Statistics for Greater Downtown Miami: * **Q1 2025 vs Q1 2024:** Sales stayed mostly flat, marginally down by 2.1% from 94 in Q1 last year to 92 sales this year. (Fig.1.1) * **Q1 2025 vs Q4 2024:** Sales dropped 21.4% quarter-over-quarter, down from 117 in the previous quarter to 92 in Q1 2025\. (Fig. 1) * Brickell maintained its position as the leading sales volume contributor in the Greater Downtown area, recording 57 sales this first quarter. The business district also reclaimed its position as the highest percentage contributor (10% year-over-year) for sales growth in this urban core grouping, outpacing Edgewater from the previous quarter. **Greater Downtown Miami Luxury Condo Quarterly Sales 2015-2025 - Fig. 2.1** **Greater Downtown Miami Luxury Condo Monthly Sales from Jan. 2016 to Mar.2025 - Fig. 2.2** Looking into the **Monthly Sales trends** of Fig. 2.2 for Greater Downtown Miami: * January 2025 closed with 30 luxury condo sales, up from 23 sales recorded in the same month a year ago. * February closed with 24 sales, lower than the previous year's 27 sales noted in the same month. * March closed with 38 sales, lower than the 44 sales recorded for the same period in 2024. **Greater Downtown Miami Luxury Condo 12-Month Sales with Trendline - Fig. 2.3** The 12-month Sales Trendline of Fig. 2.3 downshifted from a positive trajectory in Q4 2024 to a negative curve in Q1 2025\. Pairing this with insights from our daily client interactions as luxury market specialists in the Greater Downtown area, we expect a softer second quarter compared to the recent peak-season cycles. ## 2\. Q1 2025 Greater Downtown Miami Luxury Condo Prices: Up ### Q1 2025 Price per Square Foot up 5% to $925; Median Price flat year-over-year **Greater Downtown Miami Luxury Condo Quarterly Price per Sq. Ft. 2017-2025 - Fig. 3** Partly aligning with the overall Miami trend of an increase in year-over-year Price per Square Foot and decline in Median Price, Miami's urban core grouping reported the following Key Price Stats for Q1 2025: * **Q1 2025 vs Q1 2024:** Median Sale Price remained flat, adjusting 0.2%, marginally up from $1,426,995 in Q1 of the previous year to $1,430,000 for the same quarter in 2025\. (Fig. 1.1) * **Q1 2025 vs Q1 2024:** Price per Square Foot: increased 5%, up from $881 in Q1 last year to $925 in the comparable quarter of 2025\. (Fig. 1.1) * **Q1 2025 vs Q4 2024:** Price per Square Foot stayed flat, adjusting only 1.4% quarter-over-quarter, slightly up from $912 in Q4 2024 to $925 this first quarter. (Fig. 1) A look at the 9-year snapshot of quarterly luxury condo prices (Fig. 3) reveals that the Price per Square Foot continued to close in its highest ranges this first quarter, confirming good value and returns for sellers. However, drawing from our vast experience serving the Greater Downtown Miami area for two decades, we expect some price pressure going forward as the latest administrative policies, shifting macroeconomic dynamics, and this buyer's market take full effect. ## 3\. Q1 2025 Greater Downtown Miami Days on Market: Up QoQ, Flat YoY **Days on Market remained flat year-over-year.** Following the overall Miami market trend of an increase in quarter-over-quarter and year-over-year numbers, Greater Downtown Miami reported the following Days on Market (DOM) statistics: * **Q1 2025 vs Q1 2024:** Luxury condos spent only 2 more days on the market compared to the year-ago quarter, reporting flat year-over-year stats with a negligible 2.6% increase. (Fig. 1.1) * **Q1 2025 vs Q4 2024:** Luxury condos spent 13 more days on the market compared to Q4 2024, reporting a 19.4% increase in quarter-over-quarter DOM. (Fig. 1) * At 80 days, the statistic reflects an increase in decision-making timelines, consistent with typical first-quarter patterns and the prevailing buyer's market conditions, and still within a healthy range. **Greater Downtown Miami Luxury Condo Quarterly Days on Market 2018-2025 – Fig. 4** ## 4\. Q1 2025 Greater Downtown Miami Luxury Condo Inventory: Up YoY **Q1 2025 closed with 26 months of inventory.** Mostly in line with the overall Miami market trend of flat quarter-over-quarter and higher year-over-year inventory, our in-depth Greater Downtown Miami luxury condo market analysis reveals the following stats for Q1 2025: * On a quarter-over-quarter basis, inventory was up from 22 months in December 2024 to 26 months in March 2025, recording an 18.2% uptick. (Fig. 5) * On a year-over-year basis, inventory was up from 24 months in March 2024 to 26 months in March this year, reporting an 8.3% increase. With 26 months of inventory, Greater Downtown Miami remained a buyer's market, as levels significantly exceeded the 9-12-month range of a balanced market. This means buyers can expect to lead negotiations with a broader selection of condos within their preferred price bracket, while sellers will need to keep pricing flexible. As seasoned luxury market experts, **we anticipate** **inventory will continue exceeding its balanced range—even if the upcoming peak season absorbs a considerable share—keeping the market buyer-friendly through to the end of 2025.** Want to live closer to work in Brickell or the Bay in Miami's Edgewater neighborhood? With our customizable search tool, you can browse luxury condos for sale in the Greater Downtown Miami area. **Greater Downtown Miami Luxury Condo Months of Inventory from Mar. 2019 to Mar.2025 - Fig. 5** _A balanced market has approximately 9-12 months of inventory. The months of inventory are calculated as the number of active listings plus the number of pending listings divided by the average number of deals in the last 6 months._ ## Greater Downtown Miami Neighborhoods: Edgewater Market Trends (33132 and 33137) **Q1 2025 Edgewater Miami Luxury Condo Market Summary – Fig. 6** **Quarter** **Closed Sales** **% Change in Sales** **Median Sale Price** **% Change in Median Sale Price** **Median Price/Sq. Ft.** **% Change in Median Price/Sq. Ft.** **Median DOM** **Q1 2025** 20 \-41.2% $1,548,750 10.6% $961 \-1.1% 103 **Q4 2024** 34 $1,400,000 $971 84 **Q1 2025 Edgewater Luxury Condo Market Summary – Fig. 6.1** **Quarter** **Closed Sales** **% Change in Sales** **Median Sale Price** **% Change in Median Sale Price** **Median Price/Sq. Ft.** **% Change in Median Price/Sq. Ft.** **Median DOM** **Q1 2025** 20 \-13% $1,548,750 10.6% $961 2.9% 103 **Q1 2024** 23 $1,400,000 $934 86 ## 5\. Q1 2025 Edgewater Luxury Condo Sales: Down YoY ### Sales down 13% year-over-year; 12-month sales trendline negative Moving in contrast to the overall market's flat-positive quarter-over-quarter and year-over-year performance, Edgewater reported the following key sales statistics: * **Q1 2025 vs Q1 2024:** Sales activity declined 13%, down from 23 in Q1 of the previous year to 20 sales in the comparable quarter of 2025\. (Fig. 6.1) * **Q1 2025 vs Q4 2024:** Sales dropped 41.2% quarter-over-quarter, notably down from 34 in the previous quarter to 20 in Q1 2025\. (Fig. 6) Owing to below-average momentum for this time of year, the 12-month Sales Trendline of Fig. 7.2 transitioned into a negative trajectory in Q1 2025 from a positive course in Q4 2024. **Edgewater Luxury Condo Quarterly Sales 2015 - 2025 - Fig. 7.1** **Edgewater Luxury Condo 12-Month Sales with Trendline - Fig. 7.2** ## 6\. Q1 2025 Edgewater Miami Price per Square Foot: Up – Priciest in Greater Downtown ### Q1 2025 Price per Square Foot up 2.9% to $961; Median Price also up year-over-year **Edgewater Miami Luxury Condo Quarterly Price per Sq. Ft. 2017-2025 - Fig. 8** Partly in line with the overall Miami trend of an increase in year-over-year Price per Square Foot and decline in Median Price, luxury condos in Edgewater reported the following **Key Price Stats for Q1 2025:** * **Q1 2025 vs Q1 2024:** Price per Square Foot increased 2.9%, up from $934 in Q1 a year ago to $961 in the same quarter of 2025\. (Fig. 6.1) * **Q1 2025 vs Q4 2024:** Price per Square Foot stayed flat, adjusting only 1.1% quarter-over-quarter, marginally down from $971 in Q4 2024 to $961 this first quarter. (Fig. 6) A closer look at the 9-year snapshot of quarterly luxury condo prices (Fig. 8) shows that the Price per Square Foot closed in the higher ranges in Q1 2025, confirming fair value and returns for sellers in this premium bayfront neighborhood. * Edgewater maintained its title as the **most expensive neighborhood in Greater Downtown**, with its Price per Square Foot at $961 and Median Sale Price at $1,548,750. * **Q1 2025 vs Q1 2024:** Median **Sale Price increased 10.6%**, up from $1,400,000 in Q1 of the previous year to $1,548,750 for the same quarter in 2025\. (Fig. 6.1) ## 7\. Q1 2025 Edgewater Miami Days on Market: Up QoQ & YoY **Edgewater Miami Luxury Condo Quarterly Days on Market 2018-2025 – Fig. 9** **Days on Market up 19% year-over-year.** Reflecting the overall Miami market trend of an increase in quarter-over-quarter and year-over-year values, Edgewater reported the following Days on Market (DOM) statistics: * **Q1 2025 vs Q1 2024:** Luxury condos spent 17 more days on the market compared to Q1 last year, reporting a 19% increase in year-over-year stats. (Fig. 9) * **Q1 2025 vs Q4 2024:** Luxury condos stayed 19 days longer on the market compared to Q4 2024, reporting a 22% increase in quarter-over-quarter DOM. * At 103 days, the statistic reveals that luxury condos sold at a slower pace in this bayfront neighborhood as buyers and sellers took longer to reach a consensus. ## 8\. Q1 2025 Edgewater Miami Inventory: Down YoY – One of the Lowest in Greater Downtown **Q1 2025 closed with 24 months of inventory.** In contrast to the overall Miami market trend of flat quarter-over-quarter and higher year-over-year inventory, luxury condos in Miami's Edgewater neighborhood reported the following statistics: * On a quarter-over-quarter basis, inventory was up from 19 months in December 2024 to 24 months in March 2025, posting a 26.3% uptick. (Fig. 10) * On a year-over-year basis, inventory was down from 28 months in March 2024 to 24 months in March this year, recording a 14.3% decline. * At 24 months, months of inventory trended higher than the 9-12-month range of an ideal market, giving buyers the leading edge in negotiations due to having more choices in their desired price range. * In addition to being the only neighborhood in our overall review of key Miami neighborhoods to report a decline in year-over-year months of inventory, Edgewater posted the lowest inventory levels in Greater Downtown Miami. --- ### As a top seller's brokerage in Edgewater, we provide a complimentary evaluation of your luxury condo and position it to attract the best offers. Contact us and our expert real estate agents will take care of everything for you --- **Edgewater Luxury Condo Months of Inventory from Mar. 2019 to Mar.2025 - Fig. 10** _A balanced market has approximately 9-12 months of inventory. The months of inventory are calculated as the number of active listings plus the number of pending listings divided by the average number of deals in the last 6 months._ ## Greater Downtown Miami Neighborhoods: Brickell Market Trends (33129, 33130 and 33131) **Q1 2025 Brickell Luxury Condo Market Summary - Fig. 11** **Quarter** **Closed Sales** **% Change in Sales** **Median Sale Price** **% Change in Median Sale Price** **Median Price/Sq. Ft.** **% Change in Median Price/Sq. Ft.** **Median DOM** **Q1 2025** 57 \-19.7% $1,470,000 1.4% $937 7.7% 67 **Q4 2024** 71 $1,450,000 $870 60 **Q1 2025 Brickell Luxury Condo Market Summary - Fig. 11.1** **Quarter** **Closed Sales** **% Change in Sales** **Median Sale Price** **% Change in Median Sale Price** **Median Price/Sq. Ft.** **% Change in Median Price/Sq. Ft.** **Median DOM** **Q1 2025** 57 9.6% $1,470,000 1.3% $937 6.9% 67 **Q1 2024** 52 $1,451,000 $877 79 ## 9\. Q1 2025 Brickell Luxury Condo Sales: Up YoY – Highest Growth in Greater Downtown ### Sales up 9.6% year-over-year; 12-month sales trendline negative Deviating from the overall market's flat-positive quarter-over-quarter and year-over-year activity, Brickell reported the following key sales statistics: * **Q1 2025 vs Q1 2024:** Sales increased 9.6%, up from 52 in Q1 of the previous year to 57 sales for the same quarter of 2025\. (Fig. 11.1) * It's worth noting that Brickell has been the **top contributor to overall sales volume in Greater Downtown Miami since 2021**. This trend highlights the growing popularity and enduring demand for luxury housing in Miami's financial core. * Brickell emerged as the **strongest market of Q1 2025 in Greater Downtown**, with the highest percentage increase in year-over-year sales. It was also the only neighborhood in Greater Downtown to record an increase from year-ago sales. * **Q1 2025 vs Q4 2024:** Sales declined 19.7% quarter-over-quarter, notably down from 71 in the previous quarter to 57 in Q1 2025\. (Fig. 11) Even with positive momentum, the 12-month Sales Trendline of Fig. 12.2 downshifted into a negative curve in Q1 2025 from a positive trajectory in Q4 2024. **Brickell Luxury Condo Quarterly Sales 2015 - 2025 - Fig. 12.1** **Brickell Luxury Condo 12-Month Sales with Trendline - Fig. 12.2** ## 10\. Q1 2025 Brickell Price per Square Foot: Up YoY – Highest Price Gain in Greater Downtown ### Q1 2025 Price per Square Foot up 6.9% to peak of $937; Median Price flat year-over-year **Brickell Luxury Condo Quarterly Price per Sq. Ft. 2017-2025 - Fig. 13** Partly reflecting the overall Miami trend of a higher year-over-year Price per Square Foot and decline in Median Price, luxury condos in Brickell reported the following **Key Price Stats for Q1 2025**: * **Q1 2025 vs Q1 2024:** Price per Square Foot increased 6.9%, up to a record $937 from $877 in Q1 last year. (Fig. 11.1) * **Q1 2025 vs Q4 2024:** Price per Square Foot increased 7.7% quarter-over-quarter, up from $870 in Q4 2024 to $937 this first quarter. (Fig. 11) * **Q1 2025 vs Q1 2024:** Median Sale Price stayed flat, adjusting only 1.3%, marginally up from $1,451,000 in Q1 of the previous year to $1,470,000 for the same quarter in 2025\. (Fig. 11) A closer look at the 9-year snapshot of quarterly luxury condo prices (Fig. 13) reveals that Brickell closed the first quarter with a **record-high price for this area of $937/Square Foot**, indicating that most deals closed with gains in this financial district. Brickell also recorded the **highest percentage gains (6.9%)** of all the Greater Downtown neighborhoods under review, indicating that sellers received the best price appreciation for their properties in this business district. ## 11\. Q1 2025 Brickell Days on Market: Up QoQ, Down YoY – Fastest-selling in Greater Downtown **Brickell Luxury Condo Quarterly Median Days on Market 2018 – 2025 - Fig. 14** **Days on Market down 16% year-over-year.** Partly consistent with the overall Miami market trend of an increase in quarter-over-quarter and year-over-year numbers, Brickell reported the following Days on Market (DOM) statistics: * **Q1 2025 vs Q1 2024:** Luxury condos spent 12 fewer days on the market than in Q1 of the previous year, reporting a 16% decline in year-over-year stats. (Fig. 14) * **Q1 2025 vs Q4 2024.** Luxury condos stayed 7 days longer on the market compared to Q4 2024, posting a 11.7% increase in quarter-over-quarter DOM. * With luxury condos taking only 67 days to sell on average, Brickell emerged as the fastest-selling market of Q1 2025 in Greater Downtown, indicating that buyers and sellers were mostly aligned in their expectations. ## 12\. Q1 2025 Brickell Inventory: Up YoY – One of the Lowest in Greater Downtown **Q1 2025 closed with 24 months of inventory.** Partly consistent with the overall Miami market trend of flat quarter-over-quarter and higher year-over-year inventory, luxury condos in Brickell reported the following statistics for Q1 2025: * On a quarter-over-quarter basis, inventory was up from 20 months in December 2024 to 24 months in March 2025, posting a 20% increase. (Fig. 15) * On a year-over-year basis, inventory was up from 21 months in March 2024 to 24 months in March this year, reporting a 14.3% increase. * At 24 months, inventory ranged above the 9-12-month benchmark of an ideal market, reaffirming a buyer's market. * Brickell reported the lowest levels of inventory alongside Edgewater in Q1 2025\. Additionally, this financial district has been reporting the tightest supply in the Greater Downtown area over recent quarters. **Brickell Luxury Condo Months of Inventory from Mar. 2019 to Mar.2025 - Fig. 15** _A balanced market has approximately 9-12 months of inventory. The months of inventory are calculated as the number of active listings plus the number of pending listings divided by the average number of deals in the last 6 months._ ## Greater Downtown Miami Neighborhoods: Downtown Miami Market Trends (33128, 33132 and 33136) **Q1 2025 Downtown Miami Luxury Condo Market Summary - Fig. 15** **Quarter** **Closed Sales** **% Change in Sales** **Median Sale Price** **% Change in Median Sale Price** **Median Price/Sq. Ft.** **% Change in Median Price/Sq. Ft.** **Median DOM** **Q1 2025** 15 25% $1,200,000 \-7.7% $710 \-4.5% 71 **Q4 2024** 12 $1,300,000 $744 64 **Q1 2025 Downtown Miami Luxury Condo Market Summary - Fig. 15.1** **Quarter** **Closed Sales** **% Change in Sales** **Median Sale Price** **% Change in Median Sale Price** **Median Price/Sq. Ft.** **% Change in Median Price/Sq. Ft.** **Median DOM** **Q1 2025** 15 \-21.1% $1,200,000 \-16% $710 \-13.1% 71 **Q1 2024** 19 $1,428,990 $817 65 ## 13\. Q1 2025 Downtown Miami Sales: Down YoY ### Sales down 21.1% year-over-year; 12-month sales trendline negative Deviating from the overall market's flat-positive quarter-over-quarter and year-over-year performance this first quarter, Downtown Miami reported the following key sales statistics: * **Q1 2025 vs Q1 2024:** Sales dipped 21.1%, down from 19 in Q1 last year to 15 sales in the comparable quarter of 2025\. (Fig. 15.1) * **Q1 2025 vs Q4 2024:** Sales improved 25% quarter-over-quarter, up from 12 in the previous quarter to 15 sales in Q1 2025\. (Fig. 15) Owing to inconsistent momentum, the 12-month Sales Trendline of Fig. 16.2 kept its negative trajectory from Q4 2023 to Q1 2025. **Downtown Miami Luxury Condo Quarterly Sales 2015 - 2025 - Fig. 16.1** **Downtown Miami Luxury Condo 12-Month Sales with Trendline - Fig. 16.2** ## 14\. Q1 2025 Downtown Miami Prices: Down YoY ### Q1 2025 Price per Square Foot down 13.1% to $710; Median Price also down year-over-year **Downtown Miami Luxury Condo Quarterly Price per Sq. Ft. 2017-2025 - Fig. 17** Partly deviating from the overall Miami trend of an increase in year-over-year Price per Square Foot and decline in Median Price, luxury condos in Downtown Miami reported the following **Key Price Stats for Q1 2025**: * **Q1 2025 vs Q1 2024:** Price per Square Foot declined 13.1%, down from $817 in Q1 last year to $710 in the comparable quarter of this year. (Fig. 15.1) * **Q1 2025 vs Q4 2024:** Price per Square Foot decreased 4.5% quarter-over-quarter, down from $744 in Q4 2024 to $710 this first quarter. (Fig. 15) * **Q1 2025 vs Q1 2024:** Median Sale Price dipped 16%, down from $1,428,990 in Q1 of the previous year to $1,200,000 for the same quarter in 2025\. (Fig. 15.1) A closer look at the 9-year snapshot of quarterly luxury condo prices (Fig. 17) reveals that the Price per Square Foot in Downtown closed in the mid-ranges this first quarter. Recording the lowest Price per Square Foot of all the neighborhoods reviewed in our comprehensive quarterly report for overall Miami, Downtown continued offering the **most affordable entry point into Miami's luxury condo market**. ## 15\. Q1 2025 Downtown Miami Days on Market: Up QoQ & YoY **Downtown Miami Luxury Condo Quarterly Median Days on Market 2018 – 2025 - Fig. 18** **Days on Market went up 9% year-over-year.** Consistent with the overall Miami market trend of an increase in quarter-over-quarter and year-over-year numbers, Downtown Miami reported the following Days on Market (DOM) statistics: * **Q1 2025 vs Q1 2024:** Luxury condos spent 6 more days on the market compared to Q1 last year, reporting a 9% increase in year-over-year stats.s (Fig. 18) * **Q1 2025 vs Q4 2024:** Luxury condos spent 7 more days on the market compared to Q4 2024, reporting an 11% increase in quarter-over-quarter DOM. * At 71 days, the statistic remained within a healthy range, even though deals closed at a slightly slower pace. ## 16\. Q1 2025 Downtown Miami Inventory: Up YoY – Highest in Overall Miami **Downtown Miami Luxury Condo Months of Inventory from Mar. 2019 to Mar.2025 - Fig. 19** _A balanced market has approximately 9-12 months of inventory. The months of inventory are calculated as the number of active listings plus the number of pending listings divided by the average number of deals in the last 6 months._ **Q1 2025 closed with 42 months of inventory.** Echoing the overall Miami market trend of flat quarter-over-quarter and higher year-over-year inventory, luxury condos in Downtown Miami reported the following statistics for Q1 2025: * On a quarter-over-quarter basis, inventory stayed flat at 42 months between December 2024 and March 2025, declining to 38 months in January and February before increasing to reflect new sellers entering the market ahead of peak season in Q2\. (Fig. 19) * On a year-over-year basis, inventory increased from 27 months in March 2024 to 42 months in March this year, reporting a 55.6% uptick. With 42 months of inventory (39.6 on average for the quarter), Downtown Miami found itself in a strong buyer's market, as levels closed well above the 9-12-month range of a balanced market. This urban area also reported the highest inventory levels of all the Miami neighborhoods in our overall quarterly review. ## 17\. Q1 2025 Greater Downtown Miami Market Conclusion With a drop in quarter-over-quarter sales volumes and flat year-over-year sales, Greater Downtown Miami posted a stable, but slightly softer opening to 2025 compared to the overall Miami market. Brickell, on the other hand, emerged as a top-performer—the only submarket in the area to post positive year-over-year sales, thus leading growth trends across this urban core grouping. In line with the overall market, the 12-month Sales Trendline for Greater Downtown Miami and its submarkets was negative across the board, indicating a softer peak cycle ahead in Q2. In our Q1 2025 price watch, Greater Downtown Miami posted a 5% gain in year-over-year Price per Square Foot, closing within its highest ranges at $925/Square Foot. This shows that sellers continued receiving good value for their luxury condo properties in Miami's urban core. However, as seasoned market experts, we expect growing price pressure to limit gains in upcoming quarters or even set off a correction, as the current buyer's market tightens amid broader economic headwinds. A closer look reveals that Brickell provided the best value to sellers by posting the highest percentage gains in terms of year-over-year price per square foot. Edgewater remained the most expensive of all three submarkets, closing the quarter with the highest sales price of $1.54 million and price per square foot of $961. Aligning with the overall Miami market trend, Greater Downtown reported an increase in year-over-year Days on Market. Brickell, in addition to being the only neighborhood to report a decline in year-over-year DOM, emerged as the fastest-selling submarket, with luxury condos averaging just over 2 months to sell. With inventory up year-over-year across the board—except in Edgewater—and trending above the 9-12-month range of an ideal market, this urban core remained a firm buyer's market. This means buyers and investors will have more choices available within their preferred price bracket, along with the upper hand in negotiations. As luxury housing experts, we recommend that sellers price their condos with room for flexibility. If you're looking to sell your Miami condo, contact us for a complimentary expert valuation and guidance on how to position your property to yield the highest possible returns. As luxury market experts, we anticipate the following factors to shape the Miami market as we head into peak season: * We expect Miami to remain in the international buyer spotlight, backed by its No. 4 global ranking in Knight Frank's five-year growth forecast and providing exceptional value per square foot compared to Monaco, London, and New York—all while delivering world-class design, next-gen amenities, and curated lifestyles in our latest condo products. * We expect to remain a top choice for the global elite owing to our tax and business-friendly laws, adding to our burgeoning millionaire population that has grown by a staggering 94% between 2014 and 2024. * On the other hand, we also expect rising insurance costs, higher association fees, evolving administrative policies and immigration laws, along with above-6% mortgage rates to keep some buyers on the sidelines, particularly in the under $5 million and investment-focused segments. **Q1 2025 Trends Overview** **Overall Miami** **Greater Downtown** **Edgewater** **Brickell** **Downtown** **Sales** Flat-positive Flat Down Up Down **Sales Trendline** Negative Negative Negative Negative Negative **Price/Sq. Ft.** Up Up Up Up Down **Days on Market** Up Flat Up Down Up **Inventory** Up Up Down Up Up Want more Miami market insights? Subscribe (via the link on the top menu) to receive the latest Miami luxury condo news in your inbox. And if you find our blog valuable, don't forget to share it. Questions or comments about the stats? Interested in browsing the market? Just reach out directly to Sep at sniakan@blackbookproperties.com or call 305-725-0566.