50 Biscayne
50 Biscayne Blvd, Miami, FL 33132
About
50 Biscayne
50 Biscayne: Chic interiors, 5-star amenities, and luxe living – all wrapped into one iconic, architectural gem of a high-rise in the epicenter of Downtown Miami
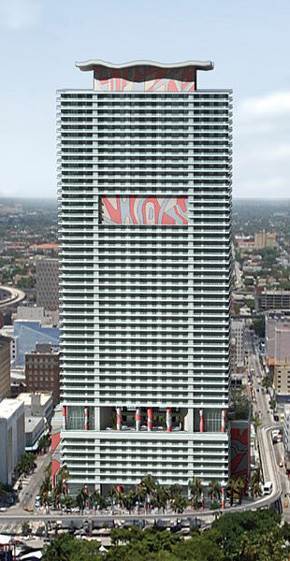
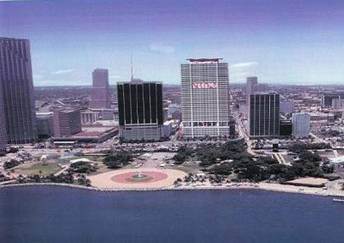
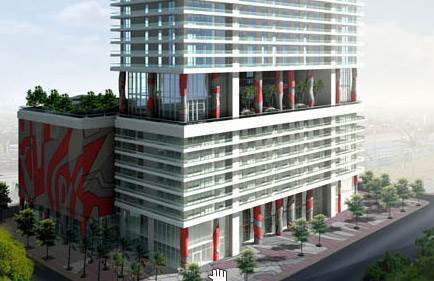
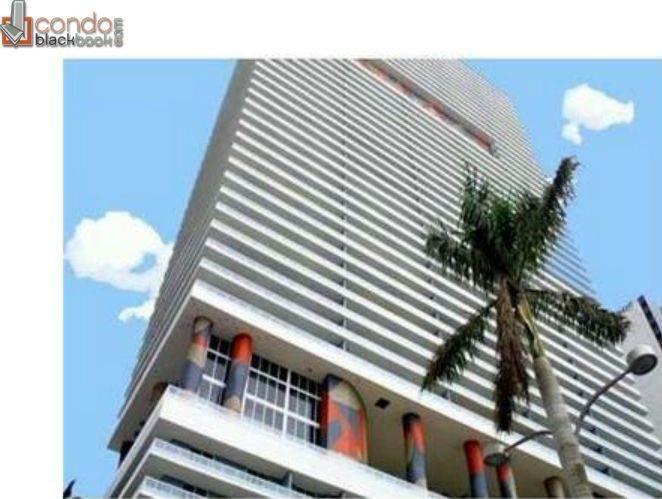
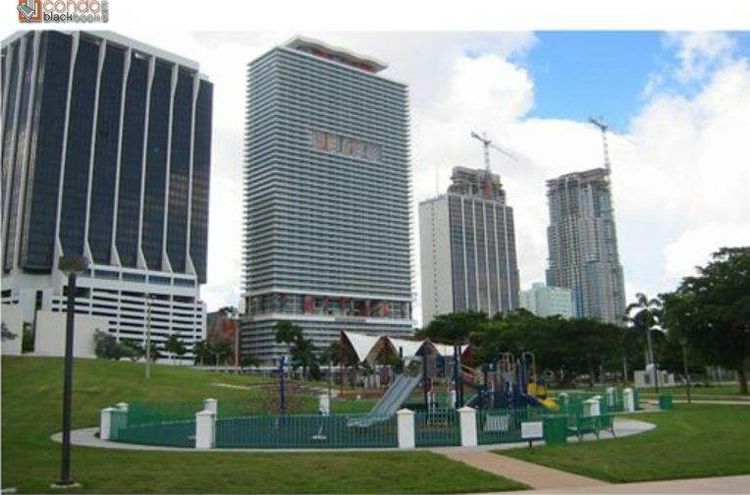
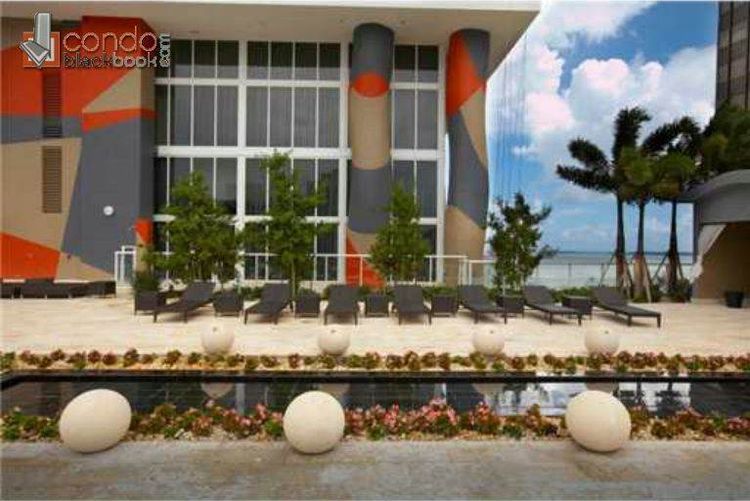
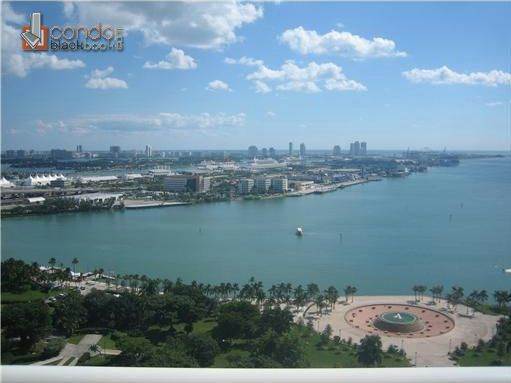
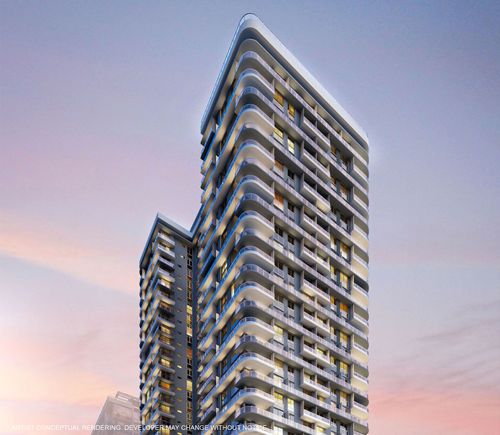
50 Biscayne stands out on Downtown Miami’s skyline with its bright murals and curvaceous columns featuring abstract art. Designed by the world-famous Rockwell Group in association with Sieger Suarez, this architecturally significant building can easily be spotted from Biscayne Bay. The 54-story high-rise sits across the 32-acre Bayfront Park and is known to offer just the right mix of amenities for a life well-lived.
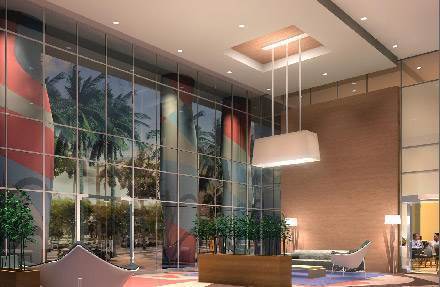
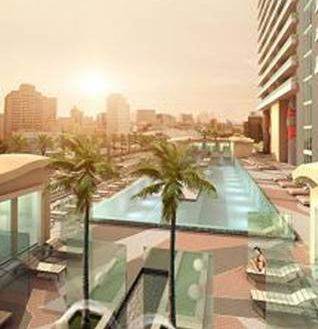
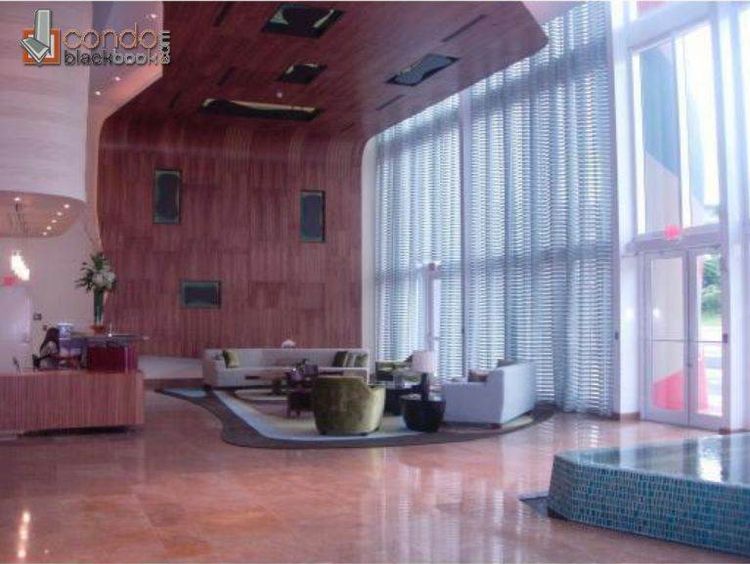
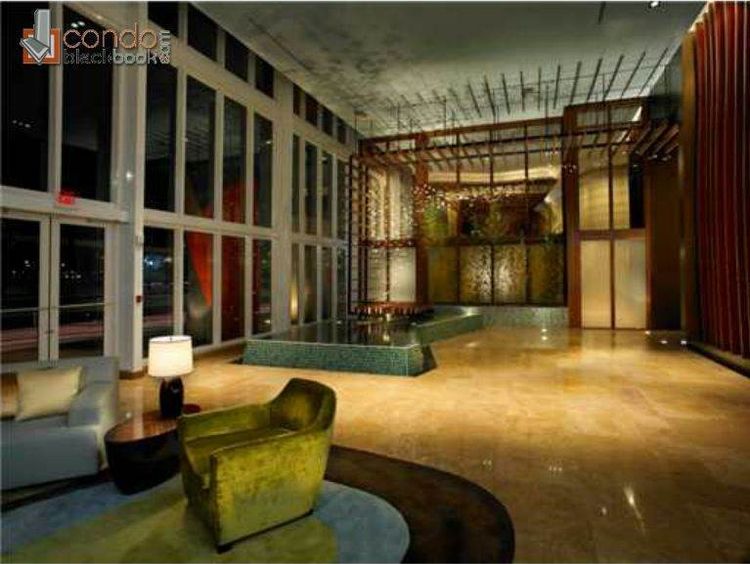
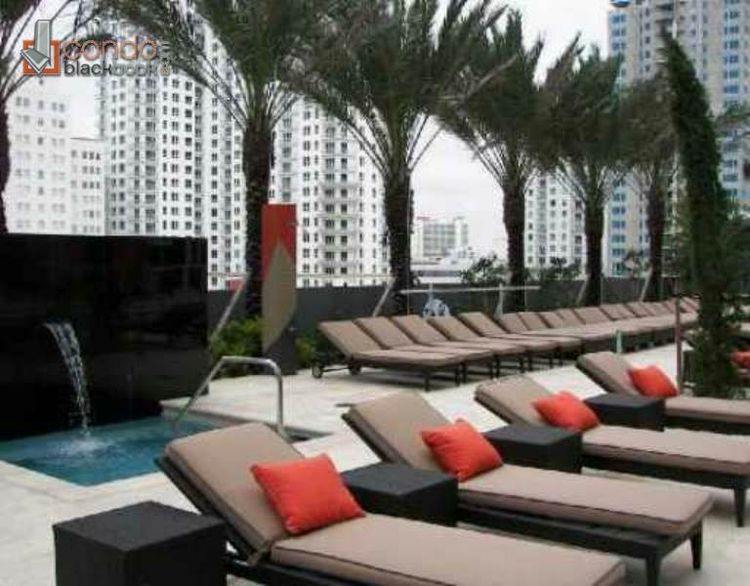
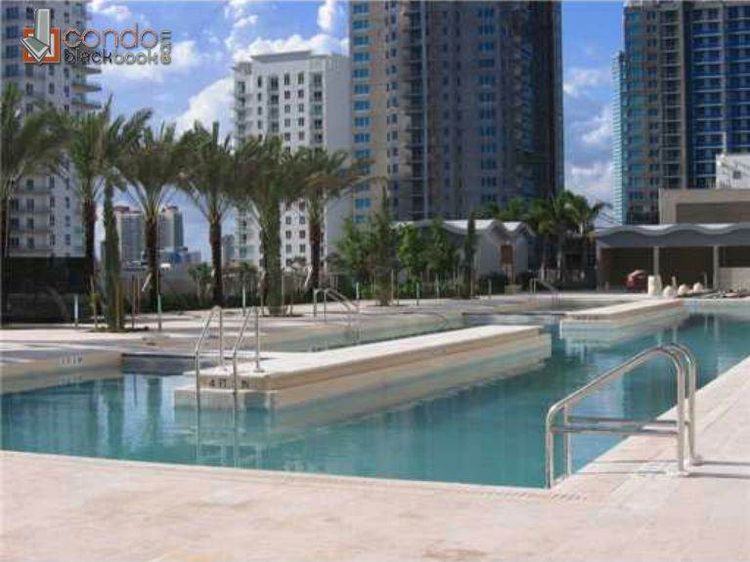
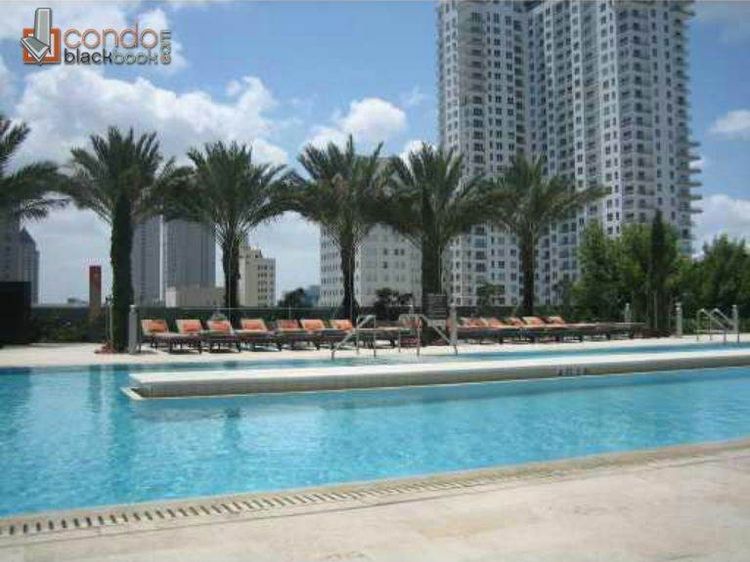
One of Related Group’s (illustrious Miami-based developer) most acclaimed condo towers, 50 Biscayne houses an upscale restaurant and 15,000 square feet of premium retail on its ground floor. Its Rockwell-designed lobby spans 3 stories and makes for a statement entrance. All 541 luxury residences in this condo high-rise feature stellar touches by Szabo and Oppenheimer. While all units enjoy spectacular city and/or bay views, those on the 38th and 40th floor especially open up to unobstructed bay views. Standout amenities include a 10th-floor Urban Oasis complete with infinity-edge pool deck plus a 2-story clubhouse as well as a 2-story spa and fitness center with 360-degree views on the 12th-floor.
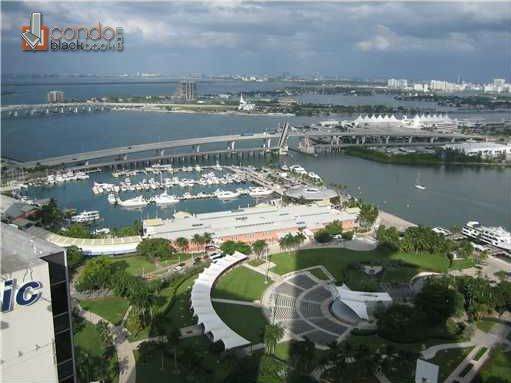
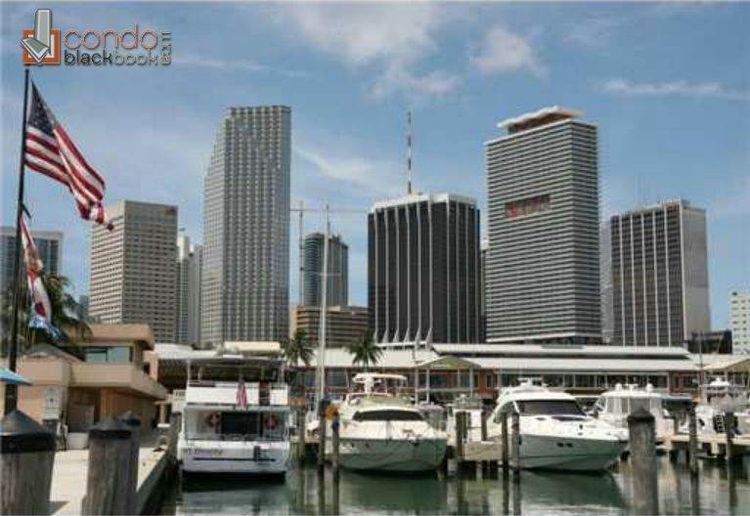
50 Biscayne stands right across the lush Bayfront Park and Biscayne Bay beyond – in the middle of the pulsating urban core of the city. Residents are within walking distance from a Whole Foods, Metromover station, the FPL Solar Amphitheater, Bayside Marketplace, the recently revitalized Flagler Street shopping/dining strip, a Silverspot cinema, the James L. Knight Center for performances, FTX Arena, Museum Park, and some of the finest restaurants in Miami. By car, Brickell is 10 minutes, Design District is 15 minutes, South Beach is 15 minutes, and the Miami International Airport is 10 minutes away.
50 Biscayne Building Amenities:
- Magnificent 3-story lobby created by world-renowned Rockwell Group
- Over 15,000 square feet of premium retail space
- Ground floor retail including a restaurant
- On-site health club, spa, and recreation rooms
- 10th-floor Urban Oasis: Pool deck with infinity-edge pool, lush tropical landscaping, daybeds, and cabanas
- 10th-floor 2-level Club Room with warming kitchen, billiards, and bay views
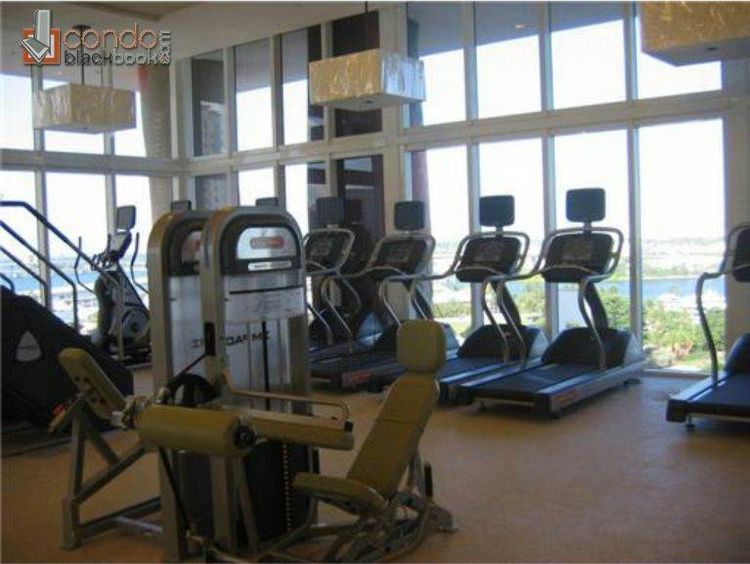
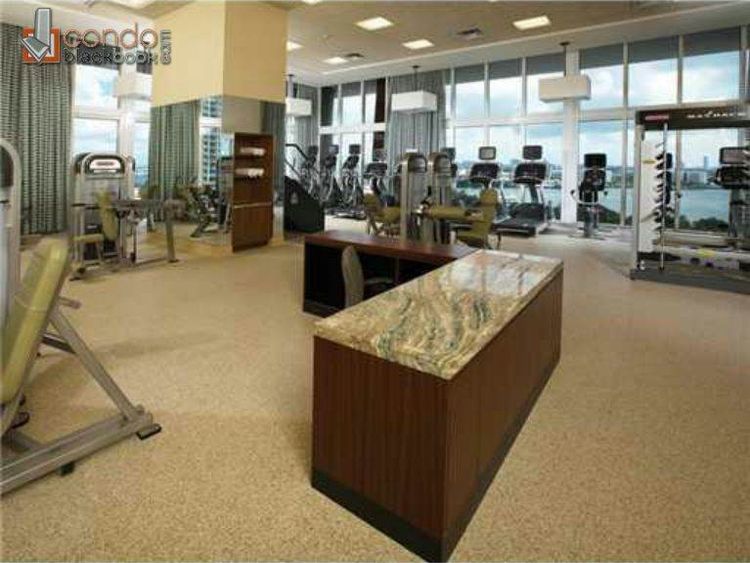
- 12th-floor 2-level Spa & Fitness center overlooking the bay with meditation rooms and Pilates
- 5 high-speed resident elevators
- 24-hour valet parking
- Assigned parking in secured garage
- Convenient mail and package receiving desk
- 24-hour concierge and security
50 Biscayne Residence Features:
- Studios, 1-bedroom, and 2-bedroom units, (some with den) & 3 bedrooms
- Glass balconies
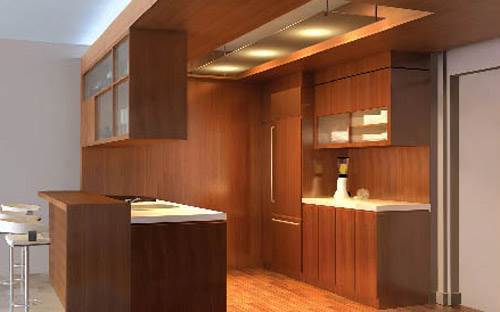
- All teak kitchen cabinets
- Upscale Berber carpet and/or other flooring packages
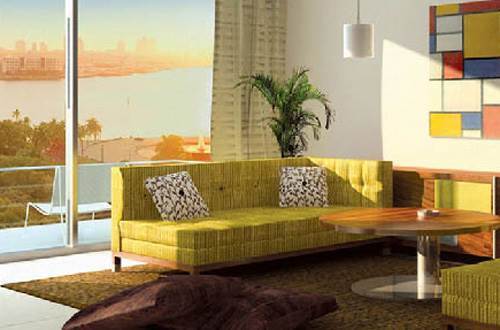
- Spacious living room with adjacent terrace (see individual floor plans)
- Continuous balconies featuring Downtown Miami's greatest views (in most units)
- Elegant ceilings rising to 8' 8"
- Spacious walk-in closets
- Top-of-the-line stackable washer and dryer
- Floor-to-ceiling laminated and energy efficient tinted windows
- High-efficiency central air conditioning and heating unit
- Pre-wired for Smart Building; multiple-jack high-speed internet, "home run" configured CAT5 cable for data/voice communications, and high-speed cable access to all television outlets.
KITCHEN:
- Della Casa premium Italian teak cabinetry
- Imported absolute black granite countertops
- KitchenAid Integrated 36" panel-ready refrigerator including freezer and ice-maker in selected units
- Bosch stainless steel self-cleaning 30" range with sleek glass cooktop in selected units
- Bosch multi-cycle pot-scrubbing dishwasher with sound insulation in selected units
- Bosch built-in microwave oven with integrated hood and light in selected units
- Modern stainless steel double sink
- Imported porcelain tile floors
- Modern track lighting
BATH:
- Della Casa Italian teak cabinetry
- Granite or marble vanity tops
- Full-width vanity mirror with decorator light fixture
- Imported porcelain tile floors and wet areas
- Glass-enclosed showers
- Elegantly detailed designer faucets
- Luxurious oversized Jacuzzi style tub
Building key details
Do you own in 50 Biscayne?
Our condo sales experts and premier marketing team can help you sell your place for top dollar.
Building Amenities
Additional details
Some useful guides for you
Here are some helpful documents and articles you might want to read.
50 Biscayne floorplans
50 Biscayne building stats
50 Biscayne building stats
Sales stats
Key averages for the building
$667,443
$613
$570,000*
*past six months
$539*
*past six months
110*
Avg Days on Market
*past six months
Sales history
Number of sold condos by month
Request info
Lifestyle
Retail
Downtown Miami
100 Montaditos Introduces Authentic Spanish Cuisine to Downtown Miami’s Restaurant Scene
Lovingly referred to as the “dollar store” of fast-food franchises, 100 Montaditos first burst onto the South Florida scene in early 2011when the first of its kind opened in mid-town Miami. Bringing with it the Spanish-inspired recipes and selection that have made it a world-renowned eatery, 100 Montaditos serves up its signature Serrano ham on olive-oil soaked oven-fresh bread for just $1\. The franchise now hosts five locations in South Florida with the most recent addition coming in July to a 3,100-square-foot location at the Vizcayne condominiums in downtown Miami, near the American Airlines Arena. The addition of 100 Montaditos to Miami’s restaurant scene cannot be understated in the value it brings to Miami’s selection of hot, new restaurants. With the ambience of a modern pub, food offerings steeped in Spanish history, and a price point that easily compares to the best other fast-food joints have to offer, 100 Montaditos is well positioned to take the region by storm. The owner of the new location, Jesus Ornia spoke confidently when he said, “I fully believe that this concept, which has been successful in Spain, will also be successful in the U.S.” The star of the menu is the $1 baguette bread (imported from Spain) sandwiches that come in one of ten varieties such as Serrano ham, pulled bbq pork, smoked salmon, and chorizo. The sister sandwich montaditos (tortilla Espanola) is fifty cents more and comes with chipotle aioli, tuna with Caesar dressing, and grilled chicken with brava sauce. The selection continues to expand with more meats and cheese but no sandwich exceeds $2.50. Other 100 Montaditos locations in South Florida include The Shops at Midtown at 3252 NE 1st St in Miami, 1520 Washington Ave. in Miami Beach, 801 S. University Dr. in Plantation, 11007 Pines Blvd in Pembroke Pines, and at 230 Miracle Mile in Coral Gables. The company plans to continue expanding into the area hoping to have between 10 to 12 restaurants opened or under construction by the end of the year. _As a downtown Miami condo owner, will 100 Montaditos become your favorite neighborhood restaurant? Or do you have your own? Chime in!_
Preconstruction
Real Estate News
Downtown Miami
600 Miami Worldcenter: Downtown Miami’s Latest Luxury, Short-term Rental Condos
It's lifestyle and investment-driven. It has absolutely no rental restrictions. It’s downtown Miami at your doorstep. It's 600 Miami WorldCenter. 600 Miami Worldcenter by Aria Development and Merrimac Ventures seeks to bring a fresh take on Downtown Miami living. Currently, this project hails as the only pre-construction project in this experimentally driven neighborhood allowing for short-term rental opportunities. Envisioned to offer modern sophistication and functionality to residents and short-term guests, this lifestyle-driven condo project is the centerpiece of the development’s 27-acre master plan, featuring access to world-renowned, high-luxe retail, food, beverage, and entertainment spaces, plus the newly completed Brightline station, in the heart of Downtown Miami. Prices at this exceptional space in the heart of Miami are starting in the $400,000s for studios and go up to $770,000 for 2 bedrooms. Completion is scheduled for 2026. ### 600 Miami Worldcenter: Downtown Living with Character Designed by the acclaimed Revuelta Architecture International, 600 Miami Worldcenter will rise as a 32-story condo community with 579 short-term rental-ready or move-in-ready residences complete with full furnishings and finishes. 600 Miami Worldcenter offers every convenience delivered with sophistication. Featuring a distinct urban landscape, this rental-ready high-rise will play on contrasting materials to create an atmosphere of luxurious functionality. Built to maximize space and bring in natural light, each luxe residence will feature interiors thoughtfully crafted by The Design Agency to offer floor-to-ceiling windows, custom Italian cabinetry, full-sized washers and dryers, and spacious built-out closets. Looking out to views of the spectacular Downtown Miami and dazzling Biscayne Bay, these condos have everything you could need to find comfort in the city. They come completely finished with sleek designs, modern chef-inspired kitchens, balconies with bay and city views, and bathrooms with glass showers and tasteful wood and stone vanities. The calming, universal design elements of these spaces also make them highly desirable to rent out to those looking to experience Miami and its high-energy, downtown scene. ### Luxury Amenities at 600 Miami Worldcenter All of the Miami Worldcenter buildings are known to be some of the most amenity-rich properties in all of South Florida, and 600 Miami Worldcenter will be no exception. Featuring a distinguished and elegant curving glass facade, and offering world-class amenities, living here, residents can enjoy a 24-hour attended lobby, a rooftop pool with relaxation areas and a summer kitchen, a world-class, state-of-the-art fitness center with an outdoor training area, a resident’s lounge with entertainment spaces, a co-working center, and more. But what makes 600 Miami Worldcenter exceptional is the plethora of dining, shopping, and entertainment options located at your doorstep. This is the opportunity to live and rent with a 27-acre world-class entertainment and dining venue that is also connected to all of Miami’s latest public transportion. Imagine walking straight from your apartment out into a lively city with just about everything you could desire right at your fingertips. Or hop on the Brightline high speed train to Aventura, Fort Lauderdale, or even Orlando and Disney World, or simply connect to the Metromover to get to Brickell for work. For those wanting to rent out their condo but not wanting the hassle of maintaining it, 600 Miami Worldcenter will offer a third-party management system to handle all of the maintenance, cleanings, and check-ins. ### 600 Miami Worldcenter - A World-Class Location in the Heart of Miami Located right in the middle of the multi-acre Miami Worldcenter neighborhood, residents will have world-class cuisine, trendy bars, and all of the best of Miami’s arts and entertainment venues like the Miami-Dade Arena, home to the Miami Heat, Perez Art Museum and Frost Science Museum, all within walking distance. This prime location is also within walking distance of the Biscayne Bay waterfront, Museum Park, and the Arsht Center for Performing Arts. It’s the perfect hub for transient business and leisure travelers, making it an ideal Airbnb opportunity. Additionally, there are multiple transit options for car-free living at your fingertips. 600 Miami Worldcenter is located within seconds from the Brightline and Metro Mover trains that offer public transportation to Brickell, the Miami International Airport, and Orlando. This is the second largest and most exciting development currently taking place in the US that you absolutely do not want to miss out on, particularly if you are looking for a new construction investment opportunity. Did we mention that there are no rental restrictions? **LET'S GET SOCIAL!** Connect with us on Instagram and Youtube. If you’d like more information on this project, a private presentation, or more details on available units, floorplans, pricing, or anything else, please call, chat, or email us directly and we would be more than happy to help.
Market Reports
Real Estate News
Downtown Miami
Edgewater
Greater Downtown Miami Luxury Condo Market Report Q3 2022
View the most up-to-date market reports. Take me there now! With signs of a slowdown first emerging in Miami's beach neighborhoods during the second-quarter, this urban core grouping followed suit with a slowdown in Q3 2022\. Considering the third-quarter is generally the slowest of the year (as confirmed by historical data) and that the luxury condo market had been reporting record sales since Q4 2020, it was inevitable for the market to pause and catch its breath. In Q3 2022, when looking at the Greater Downtown Miami neighborhood grouping, Brickell emerged as the strongest sub-market, posting the least negative impact on year-over-year sales trends. It was also the fastest-selling market for luxury condos in Q3 2022\. The waterfront Edgewater neighborhood remained the most expensive sub-market in the Greater Downtown area - reporting a median Price/SF of $867, while Downtown Miami was the most affordable overall. Overall, in Greater Downtown Miami, the market remained healthy as prices increased, days on market kept to their lowest, and inventory hovered stable year-over-year - keeping this urban core a balanced market for buyers and sellers, in an otherwise seller-friendly luxury condo market for Miami. Quick summary of Q3 2022 for the Greater Downtown Miami area includes: * **Brickell** had the **highest sales volume** (72 sales) * **Brickell** showed the **least negative impact on YoY sales growth** (-22%) * **Edgewater** posted the **highest median sales price** ($1.4 million) * **Edgewater** posted the **highest price per square foot** ($867) Read below for our exclusive and in-depth analysis on how Greater Downtown, Edgewater, Brickell, and Downtown Miami performed over Q3 2022, along with a detailed comparison to the overall Miami luxury condo market trends in terms of sales, prices, days on market, and inventory. **Overall Greater Downtown Miami Luxury Condo Markets at a Glance - Q3 2022 YoY (Number of Sales)** **Overall Greater Downtown Miami Luxury Condo Markets at a Glance - Q3 2022 YoY (Median Sales Price)** **Overall Greater Downtown Miami Luxury Condo Markets at a Glance - Q3 2022 YoY (Median SP/SqFt)** _For this report, we've only included areas with zipcodes 33129, 33130, 33131, 33132, 33137 – Brickell Hammock, Brickell, Brickell Key, Downtown Miami, Arts & Entertainment District, Edgewater, Wynwood, Midtown and the Design District_ _. This luxury condo market report only features properties priced $1 million and above, and generally does not include pre-construction condo sales._ **Q3 2022 - Greater Downtown Miami Area Luxury Condo Market Highlights** * Sales drop -38.3% year-over-year – still higher than any 3Q from 2020 or before * 12-month Sales Trendline negative for the first time since Q4 2020 * Price per Square Foot up 10.4% year-over-year to $829 * Median Sales Price flat year-over-year * Days on Market down year-over-year - still at lowest-ever * Inventory flat at 10 months * Greater Downtown Miami still a sellers' market **Q3 2022 - Greater Downtown Sub-Neighborhood Highlights** * _**Winner:**_ Brickell was the most resilient market in Q3 with lowest percentage (-22%) impact on year-over-year sales * 12-Month Sales Trendline negative across the board, except Downtown Miami * _**Winner:**_ Edgewater luxury condos offered maximum value to sellers in Greater Downtown Miami with highest percentage growth (17%) in year-over-year Price per Sq. Ft. * _**Winner:**_ Edgewater again reported the highest Median Sales Price of $1.4 million * _**Winner:**_ Edgewater continued as the most expensive neighborhood in Greater Downtown, priced at $867/Sq. Ft. * _**Winner:**_ Brickell posted the highest percentage decline in year-over-year Days on Market (-37%), emerging as the fastest-selling for luxury condos in Greater Downtown Miami * Brickell reported the lowest levels of inventory (9 months) ## Table of Contents 1. Greater Downtown Miami Luxury Condo Sales Trends 2. Greater Downtown Miami Luxury Condo Price Trends 3. Greater Downtown Miami Luxury Condo Days on Market Trends 4. Greater Downtown Miami Luxury Condo Inventory Trends 5. Edgewater Neighborhood Trends - Overall Sales 6. Edgewater Neighborhood Trends - Sales Price, Price/Square Foot 7. Edgewater Neighborhood Trends - Days on Market 8. Edgewater Neighborhood Trends - Inventory 9. Brickell Neighborhood Trends - Overall Sales 10. Brickell Neighborhood Trends - Sales Price, Price/Square Foot 11. Brickell Neighborhood Trends - Days on Market 12. Brickell Neighborhood Trends - Inventory 13. Downtown Neighborhood Trends - Overall Sales 14. Downtown Neighborhood Trends - Sales Price, Price/Square Foot 15. Downtown Neighborhood Trends - Days on Market 16. Downtown Neighborhood Trends - Inventory 17. Conclusion **Q3-2022 Greater Downtown Miami Luxury Condo Market Summary - Fig. 1** **Quarters** **Number of Sales** **% change in Sales** **Median Sale Price** **% change in Median Sale Price** **Median Sp/Sqft** **% change in Median Sp/Sqft** **Median of DOM** **Q3-2022** 106 \-31.6% $1,332,500 \-1.3% $829 10.4% 56 **Q3-2021** 155 $1,350,000 $751 86 **Q3-2022 Greater Downtown Miami Luxury Condo Market Summary - Fig. 1.1** **Quarters** **Number of Sales** **% change in Sales** **Median Sale Price** **% change in Median Sale Price** **Median Sp/Sqft** **% change in Median Sp/Sqft** **Median of DOM** **Q3-2022** 106 \-54.5% $1,332,500 \-1.3% $829 \-0.6% 56 **Q2-2022** 233 $1,350,000 $834 56 ## Q3 2022 - Greater Downtown Miami Luxury Condo Market Trends: Sales Down YoY **Q3 2022 Sales down -31.6% - Negative Trendline.** As predicted in our Q2 2022 luxury condo market report for Greater Downtown Miami, Q3 2022 reported lower year-over-year sales owing to a seasonal slowdown (as per historical analysis). Breaking its record-setting streak since Q4 2020, it was quite expected of the market to pause and catch its breath. Consistent with the slower pace of the overall Miami market, Greater Downtown Miami reported the following Sales Trends for Q3 2022: * **Q3 2022 vs Q3 2021.** Sales declined 31.6% year-over-year, down from 155 in Q3 2021 to 106 sales for the same quarter of 2022\. (Fig.1) * **Q3 2022 vs Q2 2021.** Sales dropped 54.5% quarter-over-quarter, down from 233 in Q2 to 106 sales in Q3 this year. (Fig. 1.1) It is worth nothing that even though sales may have drastically declined compared to the previous year's record-setting high, Q3 2022 volume was higher than any third-quarter noted in 2020 or from before. This indicates that the luxury condo market maintained its growth threshold set over the past two years, even as sales took a seasonal breather. * **Brickell** had the highest sales volume (72 sales). This core financial district also took over as the most resilient market in the Greater Downtown area, posting only a 22% decline in year-over-year sales. Looking into the **Monthly Sales trends** of Fig. 2.2, July reported 30 sales (compared to 65 in 2021), August reported 44 sales (against 51 in 2021), and September posted 32 sales (compared to 39 in the previous year). As real estate experts, we expect the luxury condo market to close 2022 on a soft note, considering the market usually picks up momentum only after December's Art Basel or by mid-January. With momentum slowing way down, the 12-month Sales Trendline of Fig. 2.3 expectedly took on a negative trajectory in Q3 2022 – breaking its positive streak that had continued from Q4 2020 up to Q2 2022. **Greater Downtown Miami Luxury Condo Quarterly Sales 2015 - 2022 - Fig. 2.1** **Greater Downtown Miami Luxury Condo Monthly Sales from Jan. 2016 to Sep. 2022 - Fig. 2.2** **Greater Downtown Miami Luxury Condo 12-Month Sales with Trendline - Fig. 2.3** ## Q3 2022 - Greater Downtown Miami Luxury Condo Price per Square Foot Up YoY **Q3 2022 Price per Square Foot up 10.4% to $829, Median Price flat year-over-year.** Almost in line with the overall market trend of higher year-over-year price per square foot and a lower median price, Greater Downtown Miami reported similar trends: * Price per Square Foot increased 10.4%, up from $751 in Q3 2021 to $829 in Q3 this year. (Fig. 1) * A look at the 5-year quarterly price per square foot chart in Fig. 3 below reveals that Q3 prices closed in the Higher Ranges – indicating that sellers continued receiving great value for their luxury condo investments in this mainland grouping. * Median Sales Price stayed almost flat, declining marginally by -1.3% - slightly down from $1,350,000 in Q3 last year to $1,332,500 in the comparable quarter of 2022\. (Fig. 1) **Greater Downtown Miami Luxury Condo Quarterly Price per Sq. Ft. 2017-2022 - Fig. 3** ## Q3 2022 - Days on Market Flat at Lowest-Ever in Greater Downtown Miami **34.9% decline in year-over-year Days on Market.** Partly deviating from the overall market trend of a decline in year-over-year numbers but increase in quarter-over-quarter Days on Market, Greater Downtown Miami reported the following values. In Q3 2022, luxury condos spent **30 fewer days** on the market compared to Q3 last year but the same number of days compared to the previous quarter (Fig. 4). With values still at an all-time low, this shows buyer-seller communication stayed at its best in the mainland. **Greater Downtown Miami Luxury Condo Quarterly Days on Market 2018 - 2022 – Fig. 4** ## Q3 2022 - Condo Inventory Flat YoY in Greater Downtown Miami - Moving to Balanced Market Q3 2022 closed with 10 months of Inventory. Partly deviating from the overall market trend of higher year-over-year values, inventory in Greater Downtown Miami stayed flat year-over-year. At 10 months, inventory fell within the 9-12 months benchmark of an ideal market – indicating that even though the Miami market might be seller-dominated, the urban core presented a level playing field to buyers and sellers. * On a quarter-over-quarter basis, inventory was down 25% from 8 months in June 2022\. * On a year-over-year basis, inventory stayed flat at 10 months between September of 2021 and 2022. Buyers looking to live closer to work in Brickell or the urban core of Miami can search the Greater Downtown Miami area for available condos for sale, here. **Greater Downtown Miami Luxury Condo Months of Inventory from Mar. 2019 to Sep. 2022 - Fig. 5** _A balanced market has only 9-12 months of inventory. The months of inventory are calculated as – no. of active listings + no. of pending listings divided by the average number of deals in the last 6 months._ ### Greater Downtown Miami Neighborhoods: Edgewater Market Trends (33132 and 33137) **Q3 2022 Edgewater Luxury Condo Market Summary – Fig. 6** **Quarters** **Number of Sales** **% change in Sales** **Median Sale Price** **% change in Median Sale Price** **Median Sp/Sqft** **% change in Median Sp/Sqft** **Median of DOM** **Q3-2022** 20 \-45.9% $1,355,000 8.0% $867 16.6% 64 **Q3-2021** 37 $1,255,000 $744 69 **Q3 2022 Edgewater Luxury Condo Market Summary – Fig. 6.1** **Quarters** **Number of Sales** **% change in Sales** **Median Sale Price** **% change in Median Sale Price** **Median Sp/Sqft** **% change in Median Sp/Sqft** **Median of DOM** **Q3-2022** 20 \-65.5% $1,355,000 \-5.1% $867 \-1.9% 64 **Q2-2022** 58 $1,427,500 $884 61 ## Q3 2022 - Edgewater Luxury Condo Sales Down YoY **Q3 Sales down -45.9% year-over-year - Negative trendline.** Consistent with the slowdown seen in the overall market report, Edgewater reported a decline in sales volume: * Q3 2022 vs Q3 2021. Sales decreased 45.9% year-over-year, down from 37 in Q3 2021 to 20 in this third-quarter of 2022\. (Fig. 6) * Even as quarter-over-quarter sales dropped by 65.5% (Fig. 6.1), Q3 2022 sales remained higher than any third-quarter from 2020 or before. (Fig. 7.1) With sales taking a cyclical break, the 12-month Sales Trendline of Fig. 7.2 shifted into a negative trajectory – breaking its 7-quarter streak of reporting positive curves between Q4 2020 and Q2 2022. **Edgewater Luxury Condo Quarterly Sales 2015 - 2022 - Fig. 7.1** **Edgewater Luxury Condo 12-Month Sales Trendline - Fig. 7.2** ## Q3 2022 - Edgewater Price per Square Foot Still Up at Highest in Greater Downtown Miami **Q3 Price per Square Foot up 16.6% to $867, Median Price also up 8% year-over-year.** Partially deviating from the overall market trend of higher year-over-year price per square foot and a lower year-over-year median price, Edgewater reported gains in both values: * Price per Square Foot increased by 16.6%, up from $744 in Q3 2021 to $867 in Q2 this year. (Fig. 6) * With a 16.6% year-over-year gain, luxury condos in Edgewater offered maximum value to sellers out of all the Greater Downtown Miami neighborhoods under review. * With a Price per Square Foot of $867, **Edgewater remained the most expensive neighborhood of Greater Downtown**. * Median Sales Price increased 8%, up from $1,255,000 in Q3 2021 to $1,355,000 in the same quarter of 2022 (Fig. 6) - the highest of all Greater Downtown neighborhoods under review. **Edgewater Luxury Condo Quarterly Price per Sq. Ft. 2017-2022 - Fig. 8** ## Q3 2022 - Edgewater Days on Market Up QoQ, But Down YoY **8% decline in year-over-year Days on Market.** Consistent with the overall Miami luxury condo market trend for Days on Market, Edgewater reported a decline in year-over-year numbers, but increase in quarter-over-quarter values. In Q3 2022, luxury condos spent 5 fewer days on the market compared to Q3 last year and 3 extra days compared to Q2 2022 (Fig. 9). This shows that even though sales momentum may have dropped, buyers-seller communication improved compared to a year-ago. **Edgewater Luxury Condo Quarterly Days on Market 2018-2022 – Fig. 9** ## Q3 2022 - Edgewater Inventory Flat YoY - Highest in Miami Overall **Q3 2022 closed with 12 months of Inventory.** Moving against the overall market trend of higher year-over-year inventory, Edgewater reported flat year-over-year and higher quarter-over-quarter values. At 12 months, inventory closed within the 9-12-month mark of a balanced market – indicating a level playing field for buyers and sellers, in the larger scheme of an overall seller-friendly market in Miami. * On a quarter-over-quarter basis, **inventory was up 50%** from 8 months in June 2022. * On a year-over-year basis, **inventory was flat at 12 months** between September 2021 and 2022. As a top seller's brokerage and agent in Edgewater, we can provide a free evaluation of your luxury condo and position it to attract the best offers. You can call, chat, or e-mail us and an expert, local real estate agent will help you. **Edgewater Luxury Condo Months of Inventory from Mar. 2019 to Sep. 2022 - Fig. 10** _A balanced market has only 9-12 months of inventory. The months of inventory are calculated as – no. of active listings + no. of pending listings divided by the average number of deals in the last 6 months._ ### Greater Downtown Miami Neighborhoods: Brickell Market Trends (33129, 33130 and 33131) **Q3 2022 Brickell Luxury Condo Market Summary - Fig. 11** **Quarters** **Number of Sales** **% change in Sales** **Median Sale Price** **% change in Median Sale Price** **Median Sp/Sqft** **% change in Median Sp/Sqft** **Median of DOM** **Q3-2022** 72 \-21.7% $1,332,500 \-2.1% $830 8.6% 50 **Q3-2021** 92 $1,361,485 $764 79 **Q3 2022 Brickell Luxury Condo Market Summary - Fig. 11.1** **Quarters** **Number of Sales** **% change in Sales** **Median Sale Price** **% change in Median Sale Price** **Median Sp/Sqft** **% change in Median Sp/Sqft** **Median of DOM** **Q3-2022** 72 \-47.8% $1,332,500 4.7% $830 \-0.1% 50 **Q2-2022** 138 $1,272,500 $831 47 ## Q3 2022 - Brickell Luxury Condo Sales Down YoY – Most Resilient Market in Miami Overall **Q3 Sales down -21.7% year-over-year – Negative trendline.** Historically leading the overall luxury condo market in Miami in terms of sales progression, Brickell reported the least negative impact on year-over-year sales volume of all Miami neighborhoods under our review in Q3 2022: * **Q3 2022 vs Q3 2021.** Sales declined 21.7% year-over-year, down from 92 in Q3 last year to 72 sales in Q3 2022\. (Fig. 11) * Negative year-over-year sales trend in sync with the slowdown noted in Miami overall. * Third-quarter volume at highest compared to the same quarter of 2020 and before (Fig. 12.1) – indicating the market may have lost steam seasonally but kept to its momentum gathered over the past two years. * **Brickell** again reported the **highest sales volume** out of all Greater Downtown Miami neighborhoods under review. Expectedly, the 12-month Sales Trendline of Fig. 12.2 dipped into a negative trajectory for the first time in 7 quarters. **Brickell Luxury Condo Quarterly Sales 2015 - 2022 - Fig. 12.1** **Brickell Luxury Condo 12-Month Sales with Trendline - Fig. 12.2** ## Q3 2022 - Brickell Price per Square Foot Up YoY **Q3 Price per Square Foot up 8.6% at previous peak of $830, Median Price down -2.1% year-over-year.** Price trends in Brickell followed the overall market trend of higher year-over-year price per square foot and a lower median price: * Price per Square Foot increased by 8.6%, up from $764 in Q3 2021 to previous peak of $830 in Q3 this year. (Fig. 11) * With Price per Square Foot adjusting only by a dollar quarter-over-quarter, values hovered at $830 - a peak attained in the previous quarter - indicating sellers continued receiving the best value-to-date for their luxury condos in this financial district. (Fig. 13) * Median Sales Price declined by -2.1%, down from $1,361,485 in Q3 2021 to $1,332,500 in Q3 this year. (Fig. 11) * This inconsistency in year-over-year Price per Square Foot and Sales Price trends could likely be explained by sales of smaller-sized condos ruling the quarter. Amenity-rich, smaller condos tend to fetch a higher price per square foot. **Brickell Luxury Condo Quarterly Price per Sq. Ft. 2017-2022 - Fig. 13** ## Q3 2022 - Brickell Days on Market Up QoQ, But Down YoY – Fastest-selling Market in Greater Downtown **37% decline in year-over-year Days on Market.** In sync with the overall Miami luxury condo market trend for Days on Market, Brickell also reported a decline in year-over-year numbers, but an increase in quarter-over-quarter values. In Q3 2022, luxury condos spent 29 fewer days on the market compared to Q3 last year and 3 extra days compared to Q2 2022\. This shows that even though sales volume may have dipped, closings were swifter compared to a year-ago. (Fig. 14) **Brickell Luxury Condo Quarterly Median Days on Market 2018 – 2022 - Fig. 14** ## Q3 2022 - Brickell Inventory Down YoY to Lowest in Greater Downtown **Q3 2022 closed with 9 months of Inventory.** In contrast to the higher year-over-year inventory trend noticed in the overall market, Brickell reported the lowest levels of inventory of all Greater Downtown Miami neighborhoods under review. At 9 months, inventory closed at the lower end of the 9-12-month range of an ideal market, still giving sellers the upper hand in negotiations in this sub-market. * On a quarter-over-quarter basis, inventory was up 28.6% from 7 months in June 2022. * On a year-over-year basis, inventory was down 11.1% from 10 months in September 2021. **Brickell Luxury Condo Months of Inventory from Mar. 2019 to Sep. 2021 - Fig. 15** _A balanced market has only 9-12 months of inventory. The months of inventory are calculated as – no. of active listings + no. of pending listings divided by the average number of deals in the last 6 months._ ### Greater Downtown Miami Neighborhoods: Downtown Miami Market Trends (33128, 33132 and 33136) **Q3 2022 Downtown Miami Luxury Condo Market Summary - Fig. 15** **Quarters** **Number of Sales** **% change in Sales** **Median Sale Price** **% change in Median Sale Price** **Median Sp/Sqft** **% change in Median Sp/Sqft** **Median of DOM** **Q3-2022** 14 \-46.2% $1,250,000 \-17.4% $704 \-5.8% 103 **Q3-2021** 26 $1,512,500 $747 135 **Q3 2022 Downtown Miami Luxury Condo Market Summary - Fig. 15.1** **Quarters** **Number of Sales** **% change in Sales** **Median Sale Price** **% change in Median Sale Price** **Median Sp/Sqft** **% change in Median Sp/Sqft** **Median of DOM** **Q3-2022** 14 \-62.2% $1,250,000 \-16.7% $704 \-4.9% 103 **Q2-2022** 37 $1,500,000 $740 63 ## Q3 2022 - Downtown Miami Luxury Condo Sales Down YoY **Q3 Sales down -46.2% year-over-year - Negative trendline.** In line with the negative sales trend seen in the overall market report, Downtown Miami reported a decline in sales volume: * **Q3 2022 vs Q3 2021.** Sales declined 46.2% year-over-year, down from 26 in Q3 last year to 14 in this third-quarter of 2022\. (Fig. 15) * Even as quarter-over-quarter sales dropped by 62.2% (Fig. 15.1), Q3 2022 sales registered higher than any third-quarter noted from 2020 or before. (Fig. 16.1) Even with sales taking a seasonal break, the 12-month Sales Trendline of Fig. 16.2 maintained its positive curve from Q1 this year through to Q3 2022 – owing to a record-setting first and second quarter. **Downtown Miami Luxury Condo Quarterly Sales 2015 - 2022 - Fig. 16.1** **Downtown Miami Luxury Condo 12-Month Sales with Trendline - Fig. 16.2** ## Q3 2022 - Downtown Miami Prices Down YoY, Most Affordable in Miami Overall Q3 Price per Square Foot down -5.8% to $704, Median Price also down -17.4% year-over-year. Deviating from the overall market trend of higher year-over-year price per square foot and lower median price, prices in Downtown Miami declined: * Price per Square Foot decreased by 5.8%, down from $747 in Q3 2021 to $704 in the comparable quarter of 2022\. (Fig. 15) * Looking at the 5-year snapshot of quarterly prices per square foot below (Fig. 17), we found that Downtown prices closed in the higher ranges - giving sellers great value for their luxury condo investments. * Median Sales Price also declined by 17.4%, down from $1,512,500 in Q3 2021 to $1,250,000 in Q3 this year. (Fig. 15.1) **Downtown Miami Luxury Condo Quarterly Price per Sq. Ft. 2017-2022 - Fig. 17** ## Q3 2022 - Downtown Miami Days on Market Up QoQ, Down YoY **24% decline in year-over-year Days on Market.** In line with the overall Miami luxury condo market trend for Days on Market, Downtown Miami posted a decline in year-over-year days, but increase in quarter-over-quarter values. In Q3 2022, luxury condos spent 32 fewer days on the market compared to Q3 2021 and 40 extra days compared to Q2 2022 (Fig. 18). This shows that even though sales dipped seasonally, buyers-seller communication improved compared to the previous year. **Downtown Miami Luxury Condo Quarterly Median Days on Market 2018 – 2022 - Fig. 18** ## Q3 2022 - Downtown Miami Inventory Up YoY **Q3 2022 closed with 12 months of Inventory.** Tightly in step with the overall market trend of higher year-over-year inventory, Downtown Miami reported an increase. At 12 months, inventory closed within the 9-12-month mark of a balanced market – indicating this sub-market offered buyers and sellers equal opportunity, in an otherwise seller-dominated market. * On a quarter-over-quarter basis, inventory went up 50% from 8 months in June 2022. * On a year-over-year basis too, inventory increased by 20% from 10 months in September 2021. **Downtown Miami Luxury Condo Months of Inventory from Mar. 2019 to Sep. 2022 - Fig. 19** _A balanced market has only 9-12 months of inventory. The months of inventory are calculated as – no. of active listings + no. of pending listings divided by the average number of deals in the last 6 months._ ## Q3 2022 Greater Downtown Miami Market Conclusion As predicted in our Q2 2022 luxury condo market report for Greater Downtown Miami, this urban core took a seasonal break from posting record sales since Q4 2020\. Sales cooled off across the board with a negative trendline, much like the overall Miami market trend – except in Downtown Miami, which posted a positive trendline owing to a record-breaking Q1 and Q2 in 2022. **Brickell** emerged as the most popular neighborhood in the Greater Downtown area, reporting the highest volume (72 sales) of all 3 sub-markets and lowest percentage loss in year-over-year sales (-22%). Brickell also emerged as the strongest sub-market in Miami overall, with its least negative impact on year-over-year sales growth. Deviating slightly from the overall market trend in Q3 2022 of higher Price per Square Foot and lower year-over-year Sales Price, prices mostly increased in Greater Downtown Miami. Sellers **in** **Edgewater** continued receiving maximum value for their investments, as luxury condos in the area fetched top-dollar - closing Q3 at a price of $867/square foot as well as the highest year-over-year price gains by reporting a 17% increase. Echoing the overall market trend, the Days on Market declined year-over-year for luxury condos across Greater Downtown. Brickell remained the fastest-selling market, with properties spending only 50 days on the market (on median) before closing as sold. Again, slightly deviating from the overall Miami market trend of higher year-over-year inventory, the trend remained flat in Greater Downtown. At 10 months, this core grouping leaned towards becoming a balanced market, as opposed to the seller-friendly trend noted in the overall Miami market. Considering the last quarter of the year is also slow-paced (as per historical data), we, as luxury real estate experts, expect to see the market cool-off further before picking up pace after mid-January. Additionally, we expect the following to influence the direction of the luxury condos market in Miami during the closing quarter of 2022: * Recent business migration trends coupled with South Florida's tax-saving policies will likely continue attracting high-net-worth buyers and well-paid employees. * Higher interest rates might discourage only a few sellers who may have locked in lower mortgage rates or refinanced at a more lucrative rate, considering the luxury condo market usually operates on cash. * With travel picking up, we expect South American and other foreign buyers to offset any setbacks in demand from a weakening Euro, considering our foreign buyer statistics are dominated by Latin American (39%) and Canadian (25%) clientele. * With brands like Edition, NoMad, The Standard, and Diesel building luxury condos in the urban core with more short-term rental flexibility and a shorter commute to work, we expect Greater Downtown to stay in the spotlight for buyers and investors alike. * As mentioned in previous reports, even as developers continue buying out older condo buildings to build fresh luxury, we expect the market to operate with low levels of inventory until such product is built (2-3 years) – keeping the market seller-friendly or balanced at max. for the next few cycles. **Metric** **Overall Miami** **GDM** **Edgewater** **Brickell** **Downtown** **Sales** Down Down Down Down Down **Sales Trendline** Negative Negative Negative Negative Positive **Price/Sq. Ft.** Up Up Up Up Down **Days on Market** Down Down Down Down Down **Inventory** Up Flat Flat Down Up Want more data and Miami market analyses? Subscribe (see the subscribe link on the top menu) to receive the latest market news in your inbox and share our blog. **LET'S GET SOCIAL!** Connect with us on Instagram and Youtube. Questions or comments about the stats? Interested in browsing the market? Contact Sep at sniakan (at) blackbookproperties.com or call 305-725-0566.

