In Miami's luxury real estate market, the year is off to an incredibly booming start! If we thought Q4 2020 was big, then Q1 2021 is HUGE. While we were expecting 2021 to kick off strong, the luxury condo sales numbers we've seen are unprecedented, reporting a total of 459 sales for condos priced more than $1M. Prices also responded to this sales boom and started to show an overall increase. Inventory is at an all-time low. And, we are most likely at the tail-end of a longstanding buyer's market in Miami's luxury real estate market.
With the highest quarterly sales seen in over 6 years, a new record has been set. As an increasing number of tech giants, venture capitalist firms, startups, and more businesses establish or move offices to Miami, wealthy buyers from the Northeast, Midwest, and California are transforming Miami's luxury real estate market, both for condos and single-family homes. "How long will this market-high last?" is a question best left unanswered for the moment. For now, the market mood is extremely positive, and we believe Miami is passing a growth milestone.
Below is our in-depth analysis of the Q12021 data on how prices, days on market, and inventory are responding to this explosive change in trends in our full-length Q1 2021 Miami Luxury Condo Market Report:
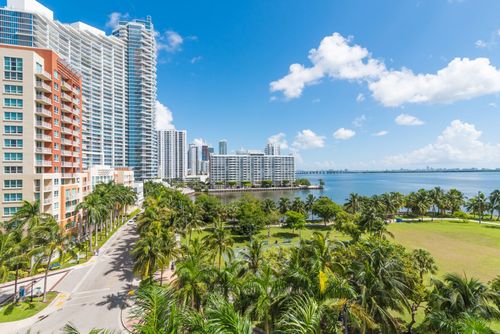
This luxury condo market report only includes data for properties priced $1 million and above, and covers the neighborhoods of Greater Downtown Miami (inclusive of Edgewater and Brickell), Miami Beach (inclusive of Surfside, Bal Harbour, Sunny Isles Beach and Fisher Island) as well as Coral Gables and Coconut Grove.
Overall Miami Luxury Condo Market Summary - Q1 2021 |
||
Quarterly sales shoot up 185.1% YoY |
Overall luxury condo price/sq. ft. up by - 8.7% YoY |
Inventory shrinks to 18 months |
Q1 2021 - Overall Miami Luxury Condo Market Highlights
- Fisher Island and Edgewater are Miami's most popular neighborhoods, leading Q1 sales growth with a 340% and 313% spike year-over-year, respectively
- Record-breaking Q1 2021, with highest quarterly sales in over 6 years
- 12-month sales trendline stays positive from Q4 2020 to Q1 2021
- Overall Prices up – Median Sales Price up 4.6% and Price per sq. ft. by 8.7% year-over-year
- Fisher Island is the most expensive neighborhood of Q1-21, posting a median price of $1,344/sq. ft. - maintains top-spot from last quarter
- Coconut Grove & Coral Gables plus South Beach offer maximum value to sellers with highest percentage growth (33%) in year-over-year price per sq. ft.
- All building segments (newly built to classic) report strong sales growth
- Sellers received maximum return on investment (ROI) for condos in luxury buildings built 1921-1999
- Days on Market up 85.8% year-over-year
- Inventory drops 58% year-over-year, showing immense progress
- Fisher Island, Coconut Grove & Coral Gables, plus Mid/North Beach post the lowest inventory (11, 13, and 13 months) of all Miami neighborhoods
- 2021 starts on an extremely powerful note, with market almost tipping from its longstanding buyer-friendly position to a seller's market
Table of Contents
- Overall Miami Luxury Condo Sales Trends
- Miami Neighborhood Trends - Number of Sales
- Overall Miami Luxury Condo Price Trends - Sales Price, Price/Square Foot
- Miami Neighborhood Trends - Sales Price, Price/Square Foot
- Overall Miami Luxury Condo Sales Price Trends by Building Year
- Overall Miami Luxury Condo Days on Market Trends
- Miami Neighborhood Trends - Days on Market
- Overall Miami Luxury Condo Inventory Trends
- Conclusion
- Where does the Miami Luxury Condo Market go from Here?
Miami Luxury Condo Sales at Record-High
|
Q1-2021 Miami Luxury Condo Quarterly Market Summary - Fig. 1.1 |
|||||||
|
Quarters |
Number of Sales |
% change in Sales |
Median Sale Price |
% change in Median Sale Price |
Median Sp/Sqft |
% change in Median Sp/Sqft |
Median of DOM |
|
Q1-2021 |
459 |
185.1% |
$1,752,000 |
4.6% |
$846 |
8.7% |
249 |
|
Q1-2020 |
161 |
$1,675,000 |
$778 |
134 |
|||
Q1 2021 sales skyrocket, up 185.1% year-over-year, set a new record
Setting a brand-new record for year-over-year sales growth, plus posting the highest sales in a quarter since 2015, the year is off to an explosive start for the luxury condo market in Miami (Fig. 1.2). With a record-making 459 closed transactions in the first quarter, sales have gone through the roof and beyond anything we were expecting.
A look at the monthly sales chart of Fig. 1.3 below shows how numbers skyrocketed towards the tail-end of the quarter. January closed with double the sales (91) compared to the previous year's 44. February posted 3.5 times (147) the sales of the same month in 2020 (42). And, March also posted 3 times the sales (221) compared to March 2020 (75).
Capturing this spike in sales momentum perfectly, the 12-month sales trendline of Fig. 1.4 continues to be a soaring positive between Q4 2020 and Q1 2021.
What's powering this sales boom? The record-breaking sales numbers we've been witnessing since last quarter comes on the heels of major technology and VC businesses relocating to South Florida. Attracted by a very favorable set of tax reliefs and benefits, scores of major businesses from New York and California have either moved to or are en route to Miami. Naturally, following this rush of office relocations, most business owners, founders, CEOs, key talent, and their followers are anchoring down into plush properties here as well. This business exodus from key financial and tech cities including San Francisco, the Bay area, and New York City, was precipitated by the now accepted work culture allowing people to work from home or remotely.
Overall Miami Quarterly Luxury Condo Sales 2015 - 2021 - Fig. 1.2

Overall Miami Monthly Luxury Condo Sales Jan. 2016 to Mar. 2021 - Fig. 1.3

Overall Miami 12-Month Luxury Condo Sales with Trendline - Fig. 1.4

Q1 2021 Miami Neighborhood Trends - Number of Sales
Q1 2021 Year-over-Year Neighborhood Sales Trends (Fig. 1.5)
- Winners: Fisher Island continues to report the highest percentage (340%) growth in year-over-year sales, closely followed by Edgewater (313%) and Mid/North Beach (289%)
- Up: All Miami neighborhoods report an increase in year-over-year sales – South Beach (276%), Sunny Isles Beach (240%), Greater Downtown Miami (200%), Brickell (136%), Surfside and Bal Harbour (88%), Coconut Grove & Coral Gables (23%)
More in-depth analysis and details are available in the dedicated reports for Greater Downtown Miami, Miami Beach and the Barrier Islands, plus Coral Gables & Coconut Grove.
Miami Neighborhood Luxury Condo Sales Comparison 1Q21-over-1Q20 - Fig. 1.5

Overall Miami Luxury Condo Prices Up - Both Sales Price & Price/Sq. Ft.
Price/square foot up 8.7% to $846, Median Price up 4.6% Year-over-Year. In response to the steady growth in sales, both the price per square foot and sales price for Miami's luxury condos posted an increase in this first quarter.
The overall Price per Square Foot went up 8.7% from $778/sq. ft. in Q1 2020 to $846/sq. ft. for the same quarter this year. Interestingly, prices have almost touched the peak of $847/ sq. ft. seen in Q2 2018 (Fig. 2.1).
The overall Median Sales Price for luxury condos in Miami also increased (4.6%) from $1,675,000 in Q1 last year to $1,752,000 for the same quarter 2021. (see Fig. 1.1)
Overall Miami Luxury Condo Quarterly Price per Sq. Ft. 2017-2021 - Fig. 2.1

Q1 2021 Miami Neighborhood Trends - Price per Square Foot & Sales Price
Q1 2021 Year-over-Year Neighborhood Price Trends
Median Price per Sq. Ft. (Fig. 2.2)
- Winner: Fisher Island continues as the most expensive neighborhood with a median price of $1,344/sq. ft.
- Winner: Coconut Grove & Coral Gables continues to report the highest percentage growth in year-over-year Price per Square Foot (33%), sharing the winning spot with South Beach, also reporting a 33% increase
- Up: Other neighborhoods posting an increase in year-over-year Price per Square Foot include Fisher Island (19%), Edgewater (18%), and Mid/North Beach (7%)
- Flat: Greater Downtown Miami posts no change in year-over-year Price per Square Foot
- Down: Neighborhoods posting a decline in year-over-year Price per Square Foot – Surfside & Bal Harbour (-34%), Brickell (-10%), and Sunny Isles Beach (-4%)
Miami Neighborhood 1Q21-over-1Q20 Median Price per Square Foot. Comparison - Fig. 2.2

Median Sales Price (Fig. 2.3)
- Winner: Coconut Grove & Coral Gables plus South Beach report the highest percentage growth in year-over-year Median Sales Price (28% and 25%), replacing Fisher Island from the top spot in Q4 2020
- Winner: Fisher Island continues to report the highest Median Sales Price for three straight quarters, now at $4.9 million in Q1 2021
- Up: Other neighborhoods reporting an increase in quarterly year-over-year Median Sales Price include Mid/North Beach (21%) and Edgewater (12%)
- Flat: Sunny Isles Beach posts no change in year-over-year Median Sales Price
- Down: Neighborhoods reporting a decline in quarterly year-over-year Median Sales Price include Surfside & Bal Harbour (-21%), Brickell (-20%), Fisher Island (-19%), and Greater Downtown Miami (-16%)
Miami Neighborhood 1Q21-over-1Q20 Median Sales Price Comparison - Fig. 2.3

Search for luxury condos for sale in Miami here.
Q1 2021 Overall Miami Sales Price Trends by Building Year
Below is a detailed analysis of how Miami luxury condo buildings performed in Q1 2021 on the basis of age of construction of the condo building, categorized as new construction buildings (2015-2021), buildings built from 2000-2014, and pre-2000 buildings.
- New Construction Buildings report record-high sales, over 2.5 times higher than those in Q1 2020 + good increase in quarter-over-quarter value for sellers
- Buildings Dated 2000-2014 post strong sales growth again, increasing 3 times over Q1 last year + 6.8% increase in year-over-year value
- Condos Built before 2000 post record-high sales, 3 times higher than those in Q1 2020 + highest year-over-year price growth (15.6%) of all 3 segments under review
Miami New Construction Condos Built 2015-2021
Making the highest peak-to-date, sales in this newly built section soared to 133 in Q1 2021. That's 2.5 times higher than those from a year ago. The segment further reports a remarkable 87% increase in quarter-over-quarter sales (Fig. 3.1).
Quarterly Overall Miami Luxury Condo Sales for Buildings Dated 2015-2021 - Fig. 3.1

Looking closely at Fig. 3.2, the Price per Square Foot declined 6% year-over-year but increased 17.6% quarter-over-quarter. Closing the quarter at $1,102/sq. ft., luxury condo sellers still got good value for their investments in this segment (Fig. 2.4).
Miami New Construction Luxury Condo Price per Square Foot (Buildings Built 2015-2021) - Fig. 3.2

Miami Luxury Condos Built 2000-2014
Sales for luxury condos built 2000-2014 also reported a spike, increasing to almost 3 times those in Q1 last year. The segment also reported a quarter-over-quarter increase of 72.4% (Fig. 3.3).
Quarterly Overall Miami Luxury Condo Sales (Buildings Dated 2000-2014) - Fig. 3.3

Looking into Fig. 3.4 below, the Price per Square Foot for the segment increased quarter-over-quarter and year-over-year. At $831/sq. ft., the Price per Square Foot is up 12.5% from Q4 2020, as well as 6.8% compared to Q1 last year (Fig. 3.4).
Overall Miami Luxury Condo Price per Sq. Ft. (Buildings Dated 2000-2014) - Fig. 3.4

Miami Luxury Condos Built Before 2000
Miami's older luxury buildings made incredible gains in Q1, posting record-high Sales in over 6 years and 3 times the sales of Q1 2020. This classic segment reported an increase of 70% quarter-over-quarter and 224.2% year-over-year. (Fig. 3.5).
Quarterly Overall Miami Luxury Condo Sales (Buildings Dated 1921-1999) - Fig. 3.5

Looking at Fig. 3.6, the Price per Square Foot for this mature segment outperformed the younger two above, posting a 12% quarter-over-quarter and 15.6% year-over-year increase. The first quarter closed with a median price of $705/sq. ft. in this older luxury segment, offering great value to owners/sellers.
Overall Miami Luxury Condos Price per Sq. Ft. (Buildings Dated 1921-1999) - Fig. 3.6

Overall Miami Luxury Condos - Days on Market Up QoQ + YoY
Days on Market up 122% quarter-over-quarter. Luxury condos spent 137 more days on market in Q1 2021 compared to Q4 2020 (Fig. 4.1). On a year-over-year basis, these luxury properties also spent 115 extra days on market (DOM) compared to Q1 2020, posting an increase of 85.8%.
With the market moving at a dramatic pace, it would be expected that the days on market drop at the same pace. However, looking at the trends in Fig. 4.1, the days on market are up significantly. DOM is cumulative, meaning even if a property is listed, paused and listed again, its DOM will not change. There were many sellers holding their line with higher prices that they were not willing to negotiate, and the market is finally catching up to their price expectations. We will likely see high DOM for the same reason during subsequent quarters until the market recalibrates.
Overall Miami Luxury Condo Quarterly Days on Market 2018 - 2021 - Fig. 4.1

Q1 2021 Miami Neighborhood Trends - Days on Market
Q1 2021 Year-over-Year Neighborhood Days on Market Trends (Fig. 4.2)
- Winner: South Beach posts no change in its quarterly Median Days on Market (0%)
- Up: All other Miami neighborhoods report an increase in their year-over-year days on market – Coconut Grove & Coral Gables (30%), Edgewater (82%), Surfside and Bal Harbour (90%), Brickell (97%), Greater Downtown Miami (98%), Sunny Isles Beach (123%), Mid/North Beach (-161%), Fisher Island (294%)
Miami Neighborhood 1Q21-Over-1Q20 Days on Market Comparison - Fig. 4.2

Luxury Condo Inventory Down to Lowest in over 2 Years, Nearing a Seller's Market
Q1 2021 closes with 18 months of inventory. Posting an extremely impressive recovery, the luxury condo market in Miami has made immense progress, bringing down inventory from a peak of 57 months to 18 in less than a year!
With sales continuing at record pace, it is exciting to see a good block of inventory move off the market after years of surplus. At 18 months, inventory has dropped 35.7% quarter-over-quarter and is down more than half (58%) since March 2020 (see Fig. 5.1).
This is the closest the months of inventory have been to the ideal benchmark of 9-12 months in over 5 years of our market study. Even though sales momentum is (historically) expected to slow down after the second quarter, this can be seen as the beginning of a shift to a more balanced or seller's market. With prices on the increase, we highly recommend buyers to make the most of this tail-end of a buyer-favoring cycle that has dominated Miami's luxury condo market since 2015 and could now possibly come to an end.
Overall Miami Months of Luxury Condo Inventory from Mar. 2019 to Mar. 2021 - Fig. 5.1

A balanced market has about 9-12 months of inventory. The months of inventory are calculated as the number of active listings + number of pending listings divided by the average number of deals in the last 6 months.
Conclusion
Record-high sales finally push Miami's luxury condo market out of long-running buyer-friendly cycle
Opening on a powerful (almost history-making) note, Q1 2021 posts record-high (459 total) sales in a quarter in over six years. Not only has the luxury condo market made an extraordinary recovery from the previous year's global setback, but it has also been catapulted into an unprecedented level of growth. With a significant number of businesses making their way to Miami from Silicon Valley and New York, there has been an exceptional surge in demand for luxury properties across South Florida, powering the remarkable opening we see in Q1, which is historically known to be a soft quarter.
This high level of luxury sales is seen across the board, with all Miami neighborhoods in our analysis contributing to the overall sales growth with positive numbers. Fisher Island and Edgewater, especially led market growth in Q1 2021 with a 340% and 313% increase in year-over-year sales, respectively. This further keeps the 12-Month Sales Trendline soaring positive from Q4 2020 to Q1 2021, showing that the market mood will remain optimistic going into the second quarter, at the least.
As a response to this incredible demand for luxury properties, prices have now started to move higher in most Miami neighborhoods. As a result, both the overall Median Sales Price and Price per Square Foot are higher year-over-year. Luxury condos in the combined neighborhood of Coconut Grove & Coral Gables plus South Beach posted maximum gains for sellers, with the highest percentage increase (33%) in their year-over-year Price per Square Foot.
Considering the high sales volume, the days on market should have declined for luxury condos in Miami. However, the days on market were higher across the board for neighborhoods in Miami (with only South Beach reporting no change). This variance has more to do with the market catching up to sellers' expectations and some inactive listings being relisted after a short hiatus (thereby increasing the overall days spent on market),rather than any gap in buyer-seller expectations.
Again, with sales momentum peaking this quarter, luxury condo inventory dropped significantly over the first quarter. Down to only 18 months from a peak of 57 months this past June, the market is showing clear signs of a correction. Fisher Island, Coconut Grove & Coral Gables, and Mid/North Beach are poised to be one of the first neighborhoods to post a correction to a balanced market.
If sales momentum were to continue as it has, Miami's luxury condo market could find itself in a seller's market very soon. However, considering sales usually take a break after Q2, the market will still have corrected enough to finally come out of its longstanding buyer-friendly state. This is important for both buyers and sellers to note.
For buyers looking to make the most of this tail-end of their favorable market cycle, you can search for all currently listed luxury condos for sale in Miami here.
Miami's Luxury Condo Market Prediction 2021: Where Does the Market Go From Here?
With a fantastic opening that has left 2020 and its uncertainties far behind, there is much to look forward to for the luxury condo market in Miami. But, where will the luxury condo market in Miami go from here as we go further into 2021?
We expect the following factors to influence the luxury condo market's performance over the course of the year:
Incoming Buyer-Wave to Continue. With more and more businesses (from high-tax states) getting on the bandwagon to move to Miami for our various tax benefits, as well as a general consensus that Miami offers a high-quality, work-from-home lifestyle, we expect this current demand to keep up in the second quarter, at least.
As this business migration brings with it some of the wealthiest and most notable business owners, tycoons, venture capitalists, CEOs, and key talent to South Florida, we expect these high-power individuals to continue fueling this demand for luxury properties as they search for that perfect waterfront home or amenity-rich luxury home in their new business haven with lower taxes and no personal income tax.
(Watch and read more on this here with our featured story from The Next Miami.)
Beaches, great year-round weather, and #WFH flexibility. Miami is known for its warm, sunny winters, balmy beaches, and breezy outdoor spaces. Couple that with the newfound flexibility offered to many to work from home, we expect strong demand to continue coming in from the Northeast as well as California. People looking for a home office by the ocean or in some of the most amenity-rich or future-forward buildings in the country, have plenty of options to choose from in Miami.
Inventory Keeps Low Levels. Even as luxury condo developers plan to bring in more projects to cater to this new breed of business heads coming to Miami, we do not expect inventory to fall back to its 2020 peak of 57 months any time soon. With fewer pre-construction deliveries expected in the near future and sales continuing at the current or even a slightly slower pace, we expect inventory to continue to decrease or adjust only slightly higher over the next few cycles. With the market already on the brink of a correction (as predicted), we expect it to move completely out of its long-running buyer-friendly position within 2021.
If you'd like more details on the data in our exclusive Condo Blackbook quarterly luxury condo market reports, please send us an email or call us anytime.
Love what you see? Share our blog and subscribe (see the subscribe link on the top menu) to receive authoritative and vetted Miami real estate market news in your inbox. Also, keep up with us on your favorite social media platforms. We're on Instagram, Facebook at @blackbookproperties and Twitter @BlackBookMiami.